Income Statement (Profit & Loss)
An automatic income statement that categorizes your accounts into income and expense sections and calculates net profit or loss, with optional period comparison.
Purpose
The Profit & Loss report provides a summary of your organization's revenues and expenses over a specified period, automatically calculating net profit or loss. It is generated entirely from account types -- no manual configuration of report lines is needed.
Generating the Report
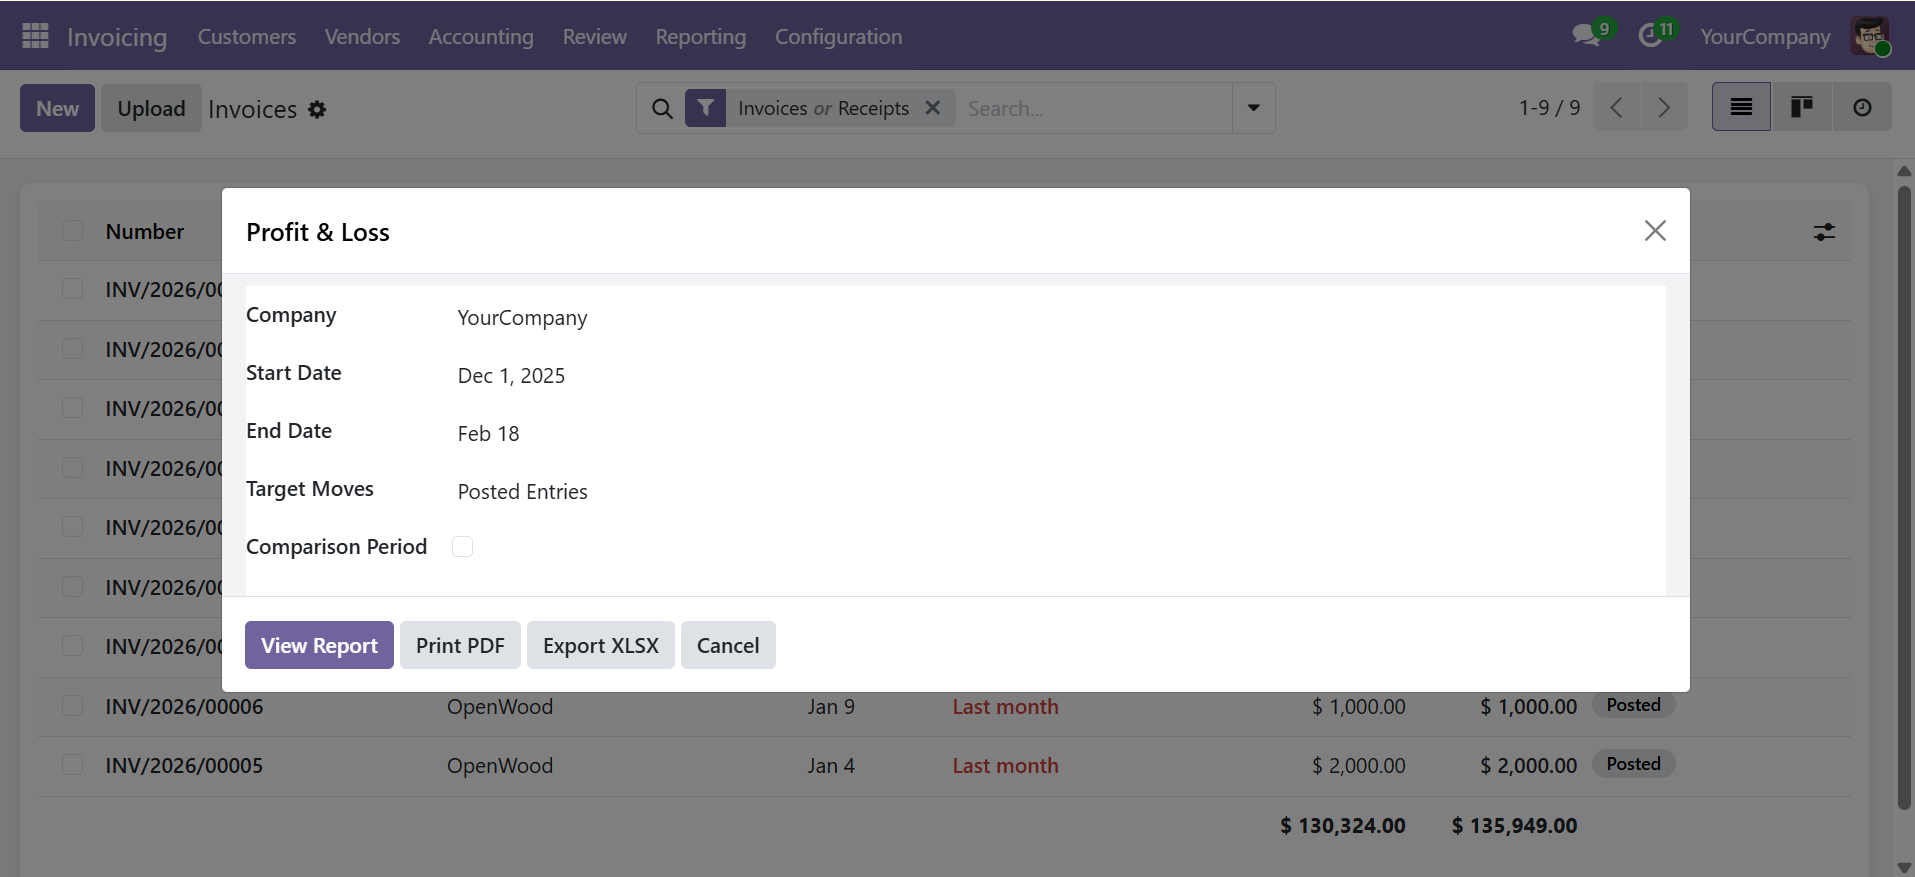
Navigate to Accounting > Reporting > Financial Reports > Profit & Loss to open the wizard.
Wizard Parameters
| Parameter | Description |
|---|---|
| Company | Company to report on (required) |
| Date From / Date To | Reporting period (required) |
| Target Moves | Posted Entries (default) or All Entries |
| Comparison Period | Enable comparison with a second period |
| Comparison Date From / To | Second period dates (when comparison is enabled) |
Click View Report to display the interactive view, Print PDF for a formatted document, or Export XLSX for a spreadsheet.
Report Structure
The report is automatically structured into three sections:
| Section | Account Types Included | Calculation |
|---|---|---|
| Income | Income, Other Income | Credit - Debit (positive = income) |
| Expense | Expense, Depreciation, Cost of Revenue | Debit - Credit (positive = expense) |
| Net Profit / Loss | Calculated | Total Income - Total Expense |
Report Output
| Column | Description |
|---|---|
| Section | Income or Expense |
| Code | Account code |
| Account Name | Account name |
| Amount | Balance for the reporting period |
The net profit or loss is displayed at the bottom of the report as a highlighted total row.
The Profit & Loss report is generated entirely from account types. No manual configuration of report lines is needed. Each account with matching types will appear automatically.
Comparison Period
Enable the Comparison Period checkbox to add a second set of columns for a comparison period. This is useful for:
- Month-over-month performance analysis
- Year-over-year growth tracking
- Quarter-over-quarter trend identification
When comparison is enabled, the report shows both periods side by side for easy visual comparison.
Export Options
- View Report -- Opens an interactive list view with sorting and searching
- Print PDF -- Generates a professional landscape A4 PDF with company branding
- Export XLSX -- Downloads a formatted Excel file with section highlighting
Contact SDLC Corp at sdlccorp.com/contact-us or email sales@sdlccorp.com