Interactive Analytics Dashboard
The dashboard provides a real-time overview of your inventory health with interactive charts, KPIs, and actionable insights.
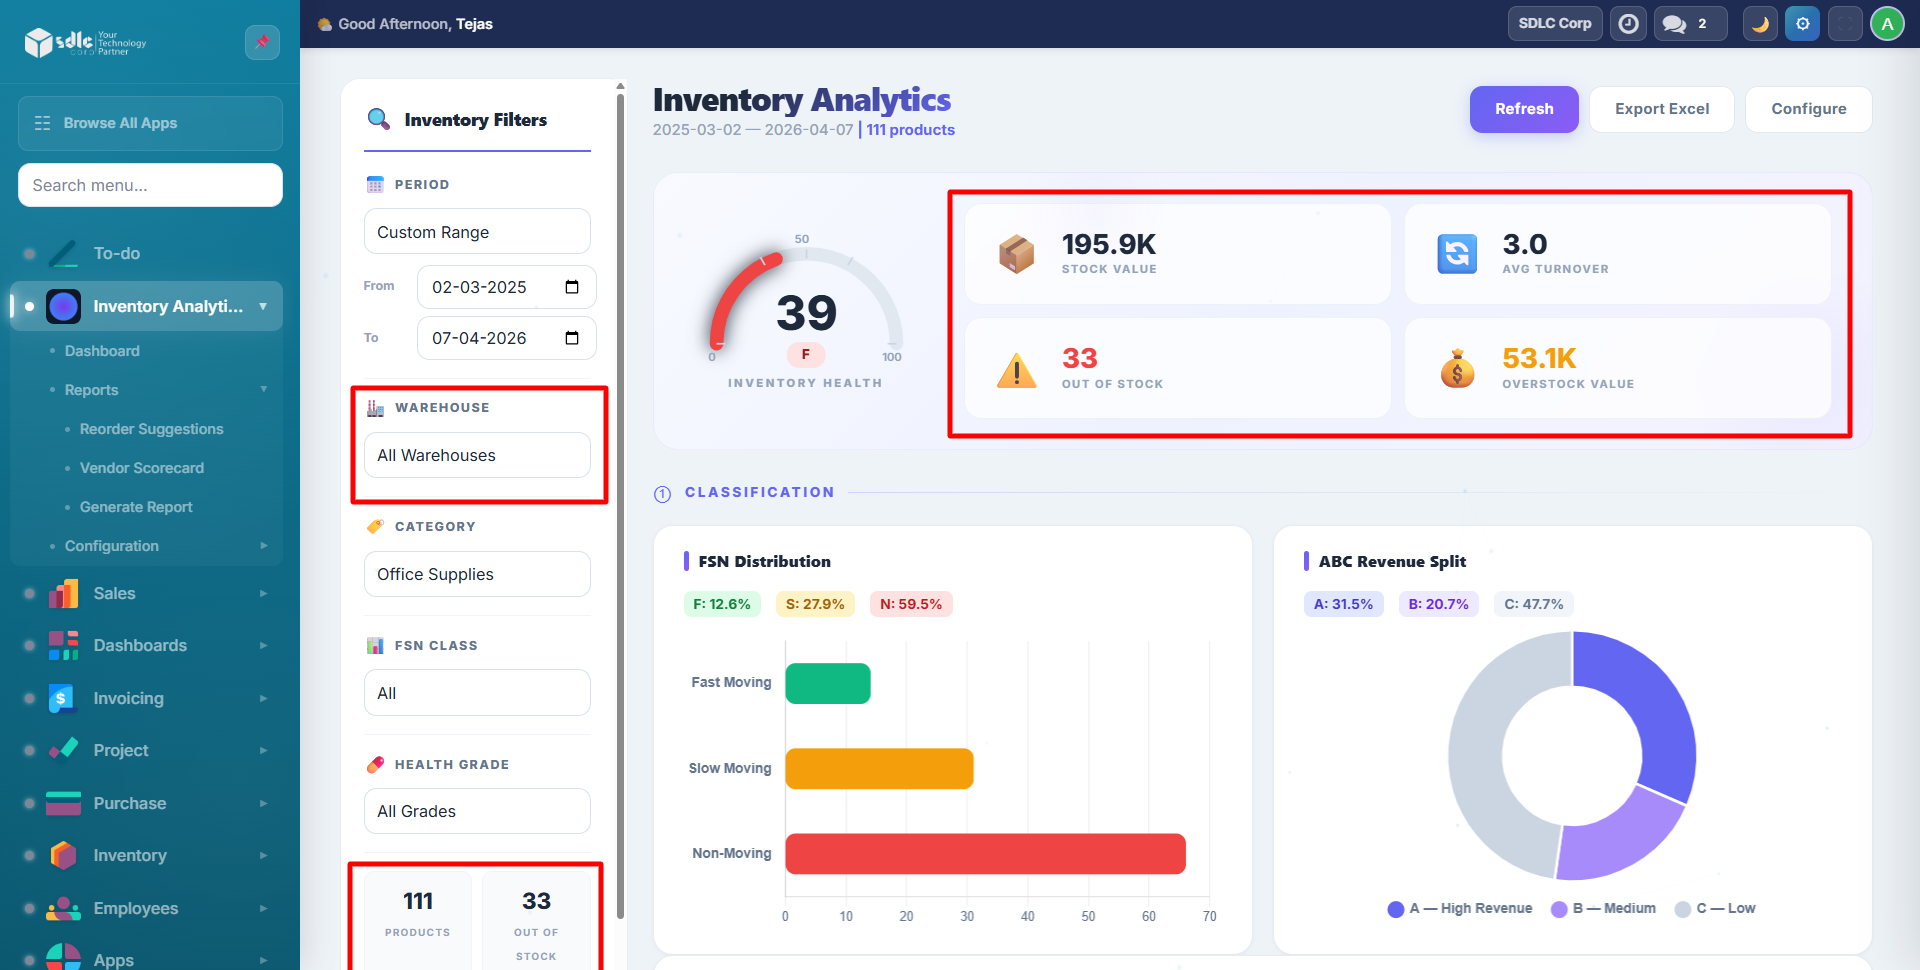
Health Score Gauge
The central gauge shows your overall inventory health on a 0-100 scale:
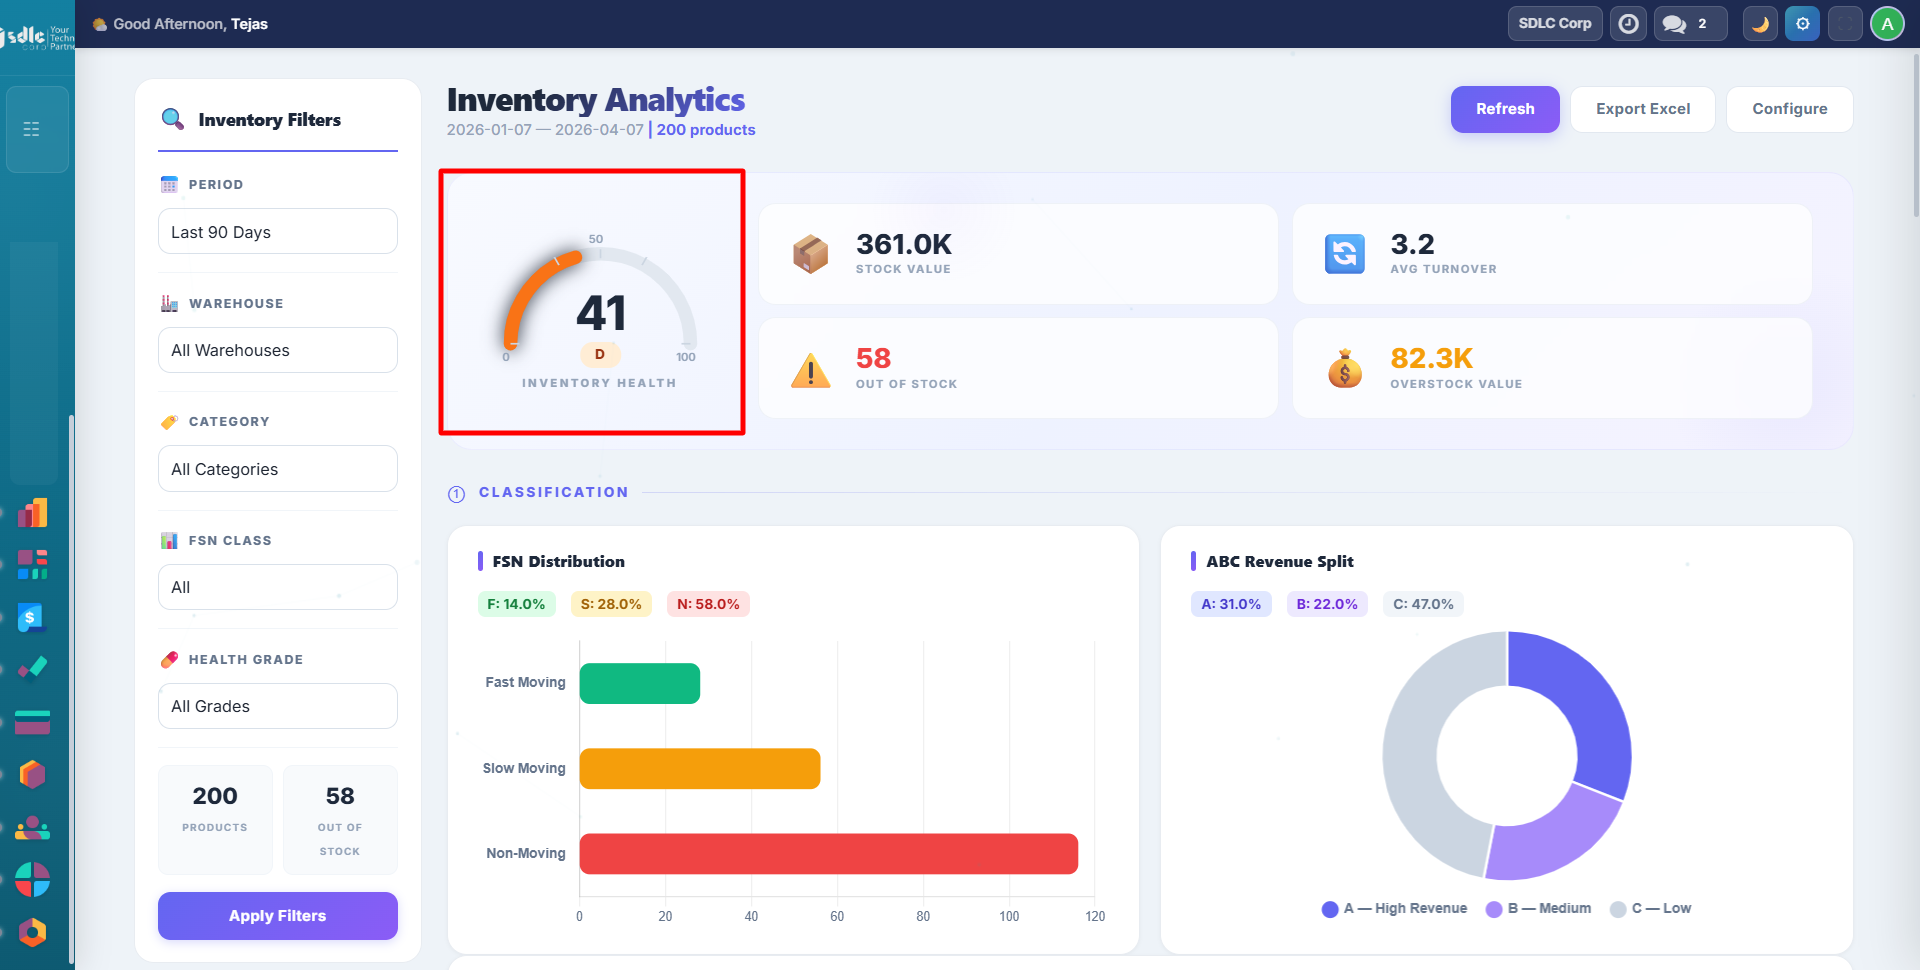
| Grade | Score | Meaning |
|---|---|---|
| A | 85-100 | Excellent: well-optimized inventory |
| B | 70-84 | Good: minor improvements possible |
| C | 55-69 | Average: attention needed |
| D | 40-54 | Poor: significant issues |
| F | 0-39 | Critical: immediate action required |
The score is a weighted composite of: turnover ratio (30%), gross margin (20%), days of stock (25%), stock age (15%), and out-of-stock penalty (-10 points).
KPI Cards
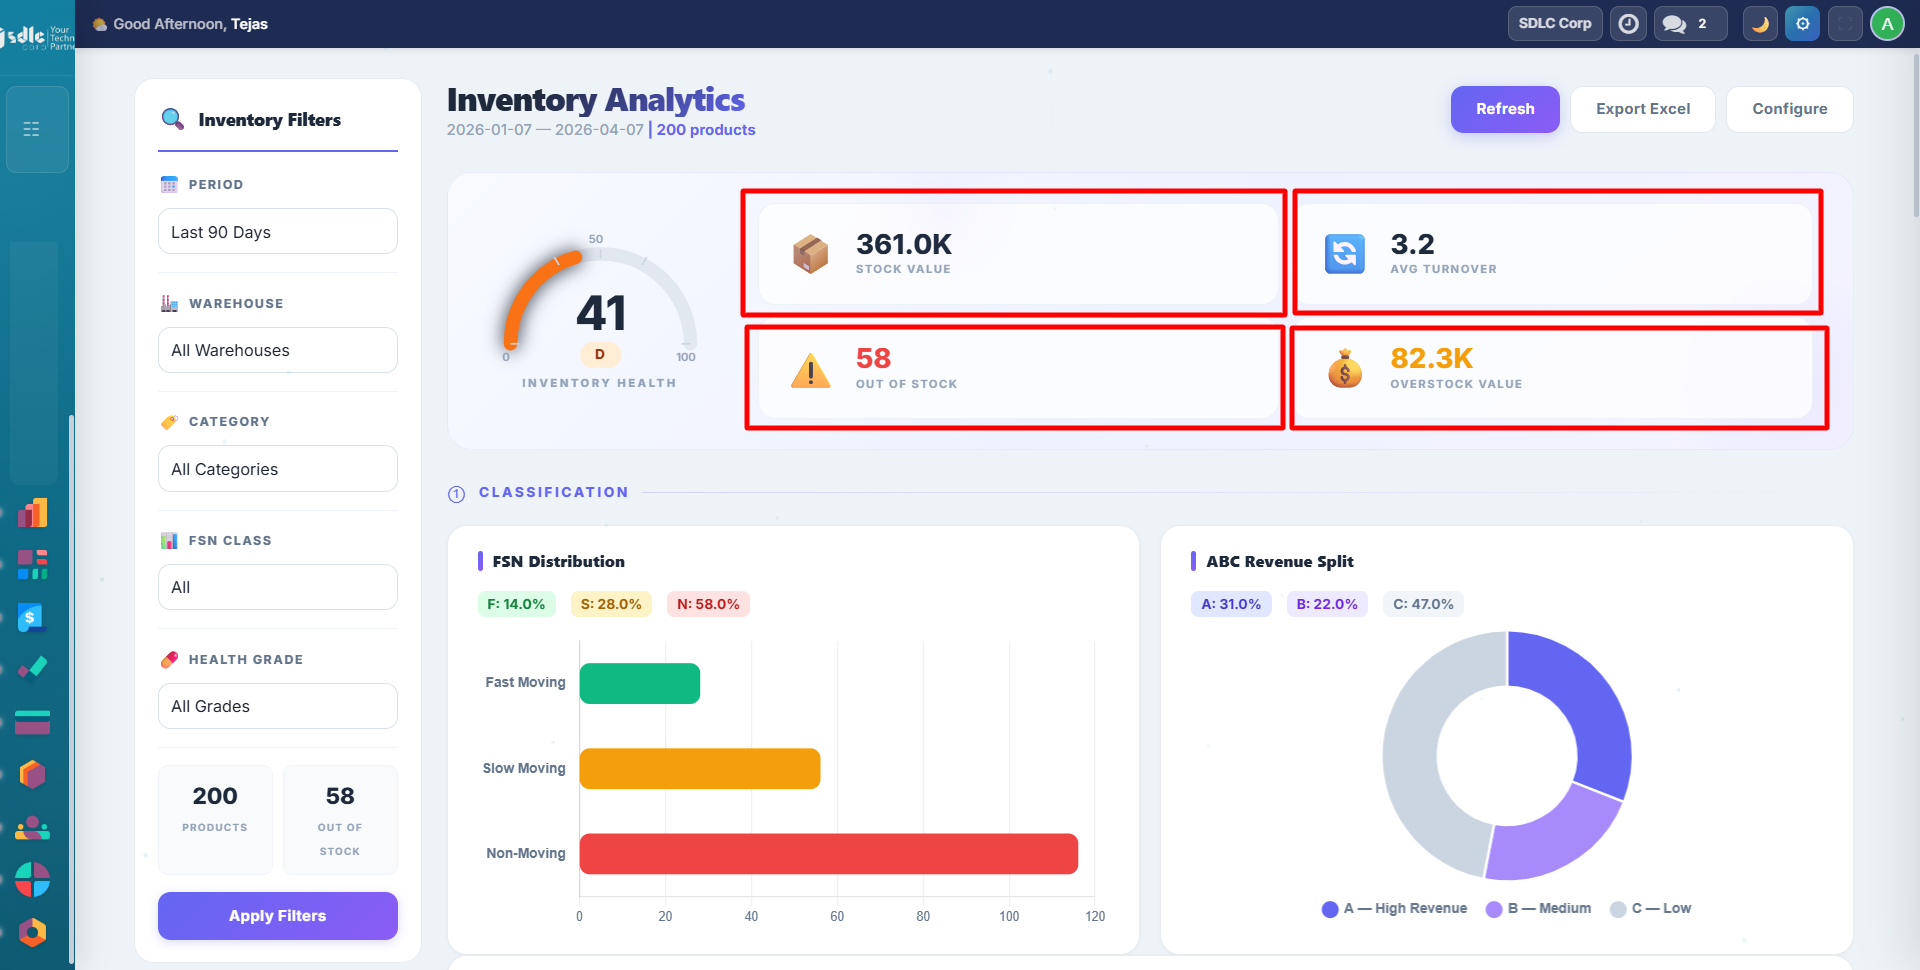
| KPI | What It Shows |
|---|---|
| Stock Value | Total value of all inventory on hand |
| Avg Turnover | Mean turnover ratio across all products |
| Out of Stock | Count of products with zero stock |
| Overstock Value | Total value of excess inventory (beyond 90-day need) |
Filters
Use the left sidebar to filter dashboard data:
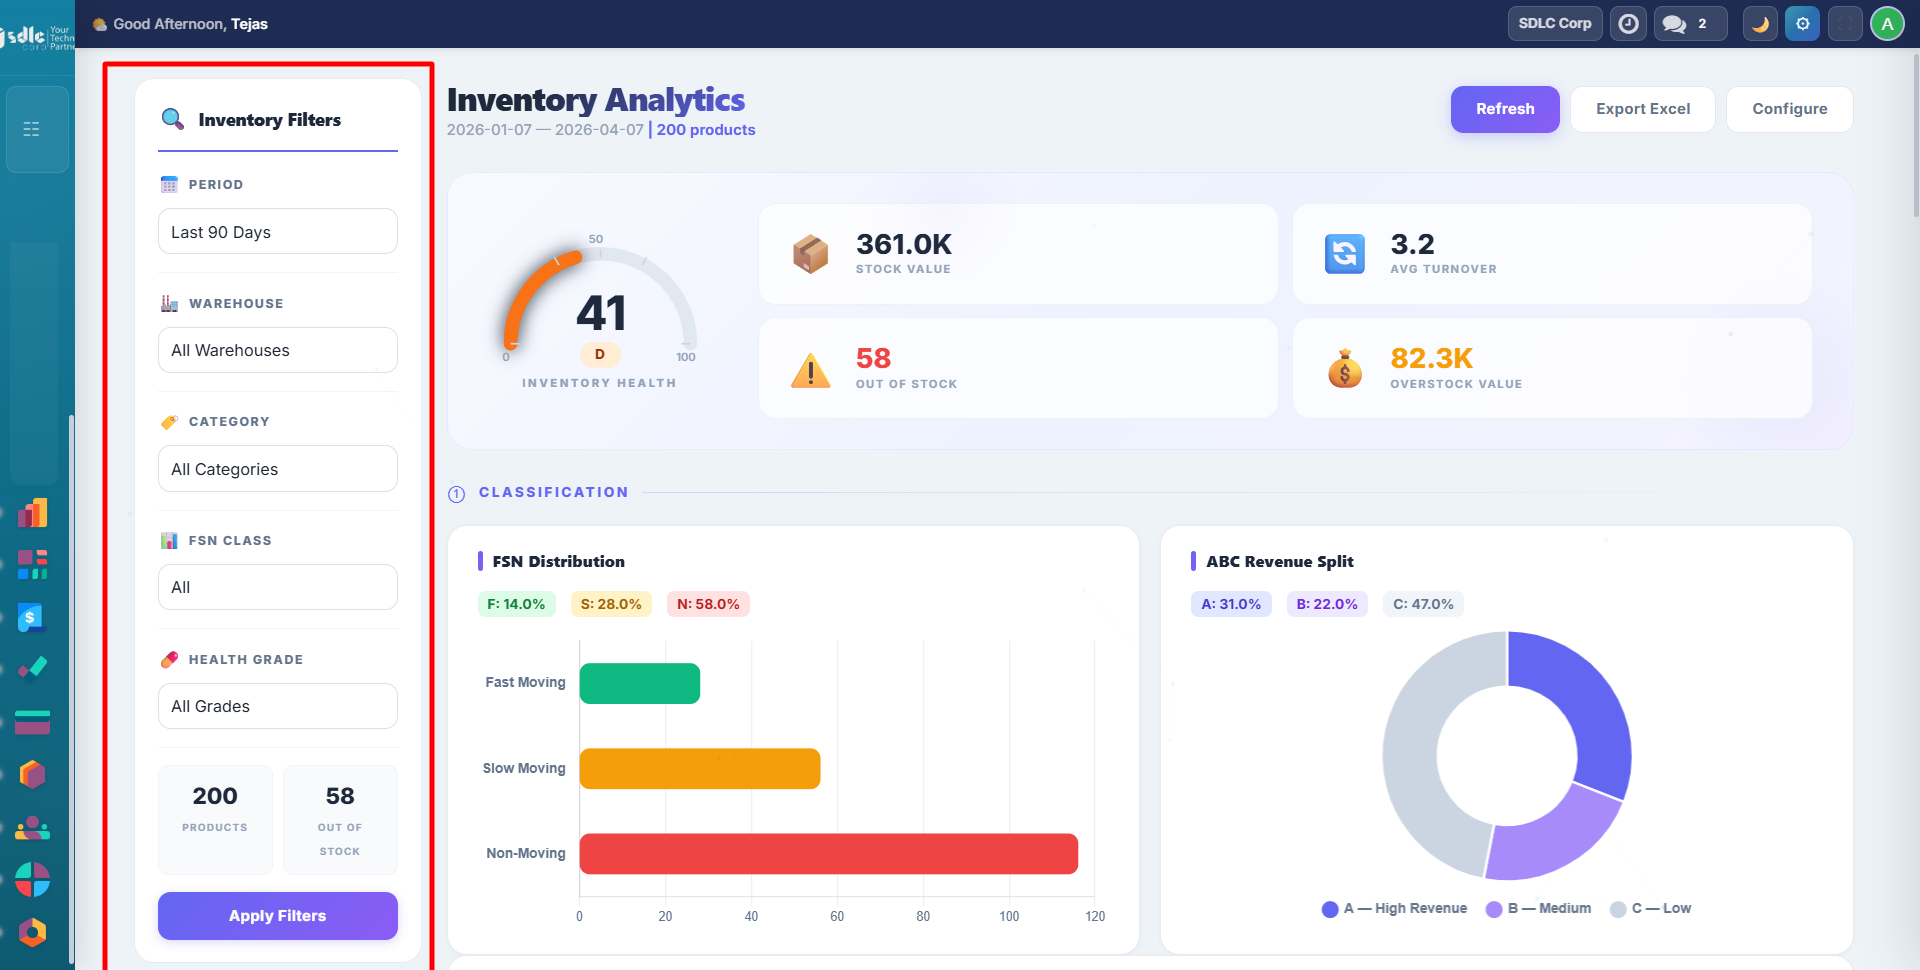
| Filter | Options |
|---|---|
| Period | Last 30/90/180/365 days, or custom date range |
| Warehouse | All or specific warehouse |
| Category | All or specific product category |
| FSN Class | All, Fast, Slow, or Non-Moving |
| Health Grade | All, A, B, C, D, or F |
Custom date range:
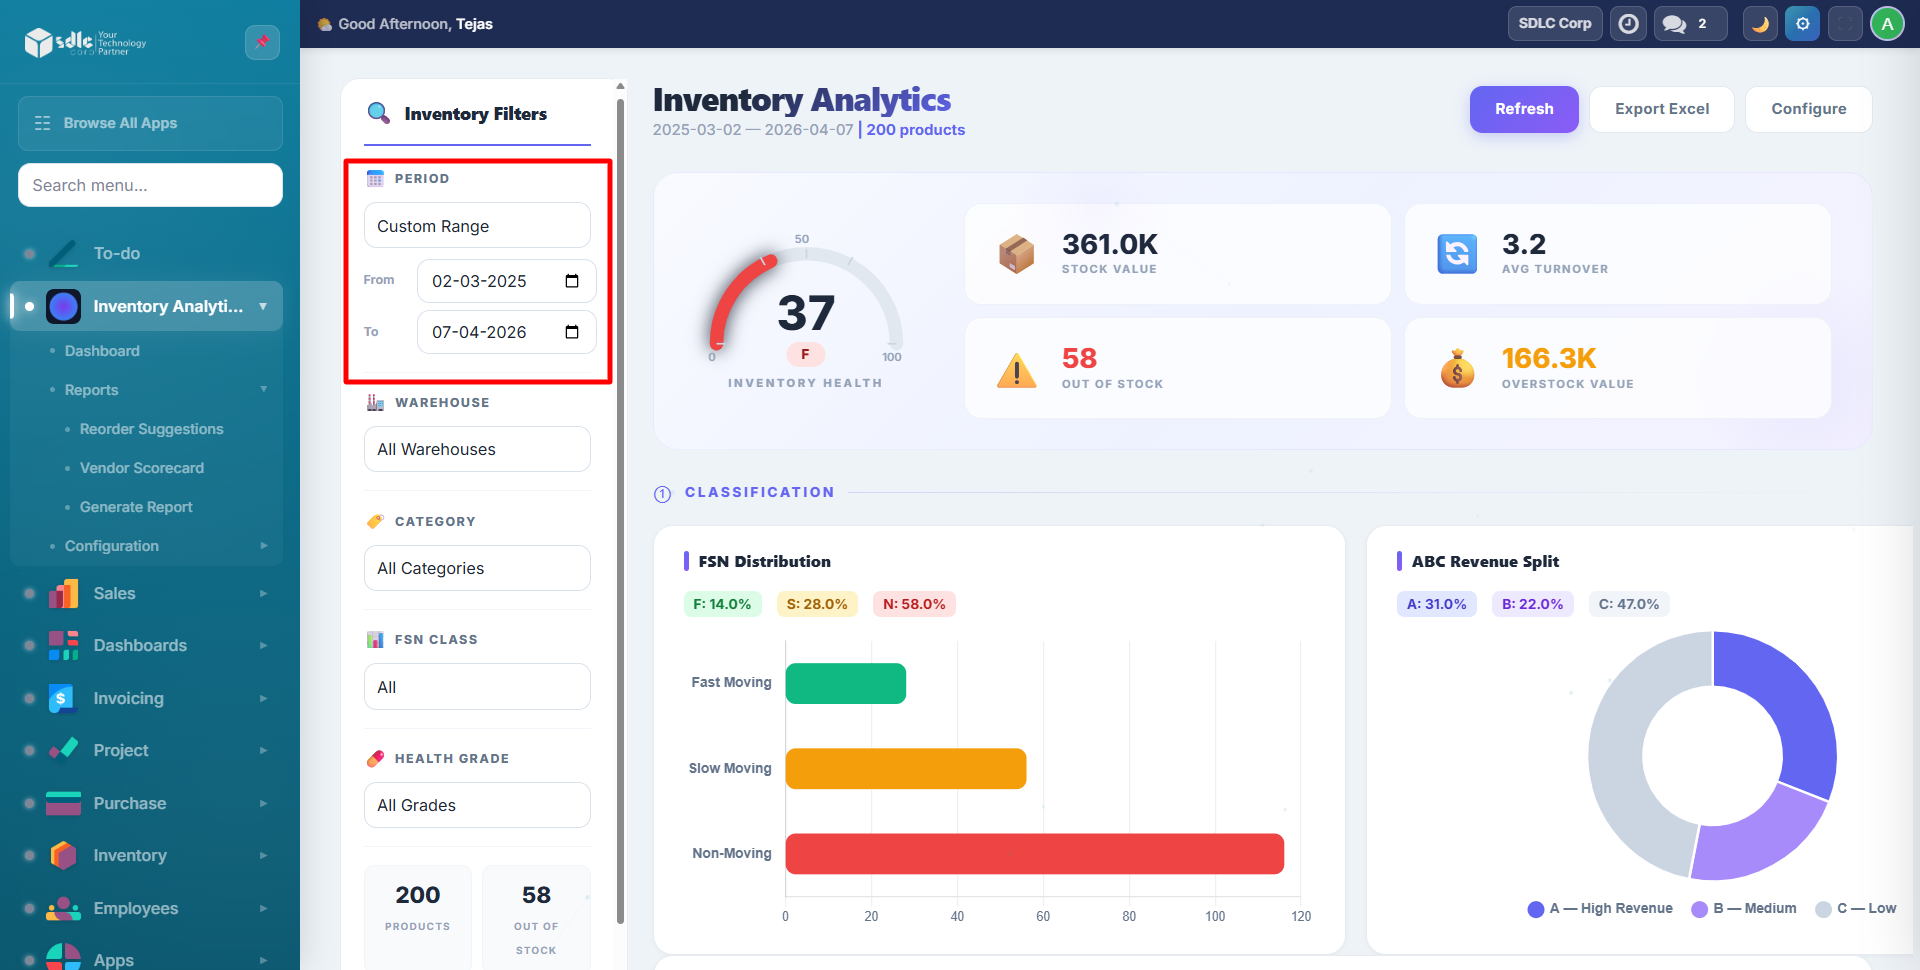
Filtered results:
Classification Charts
FSN Distribution
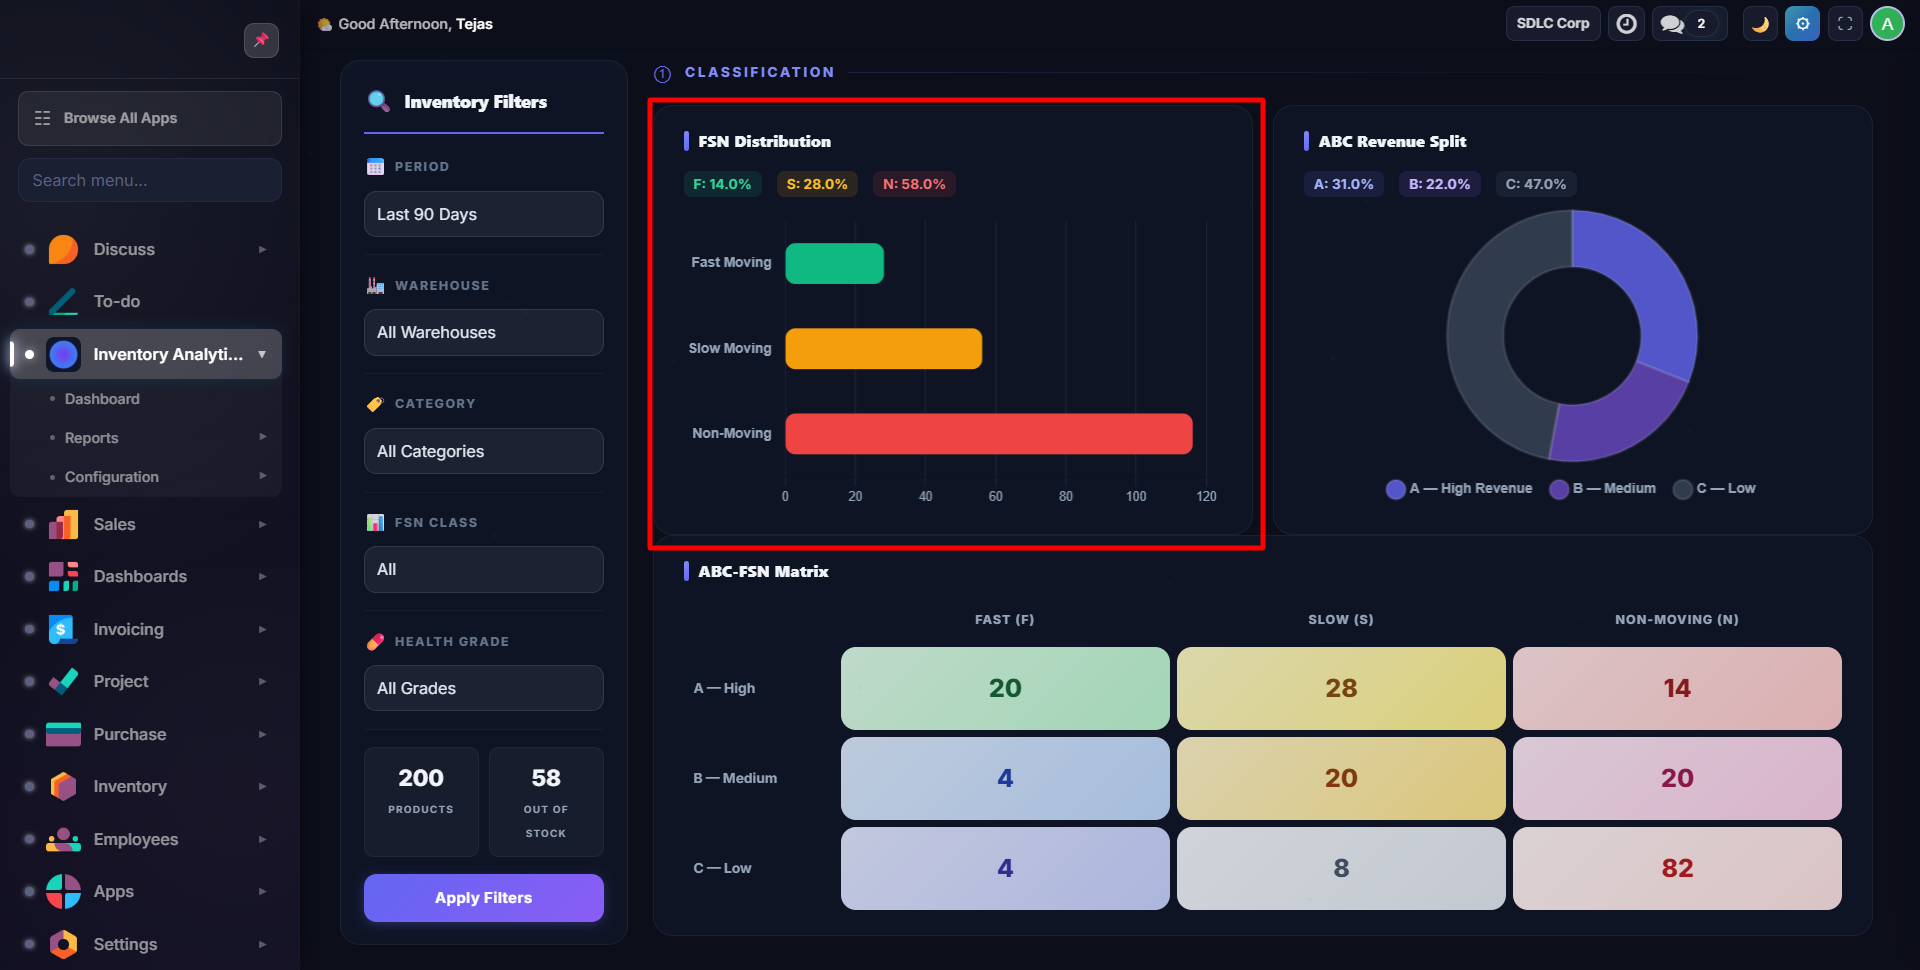
- Fast Moving (F): Turnover ratio > 3
- Slow Moving (S): Turnover ratio 1-3
- Non-Moving (N): Turnover ratio below 1
ABC Revenue Split
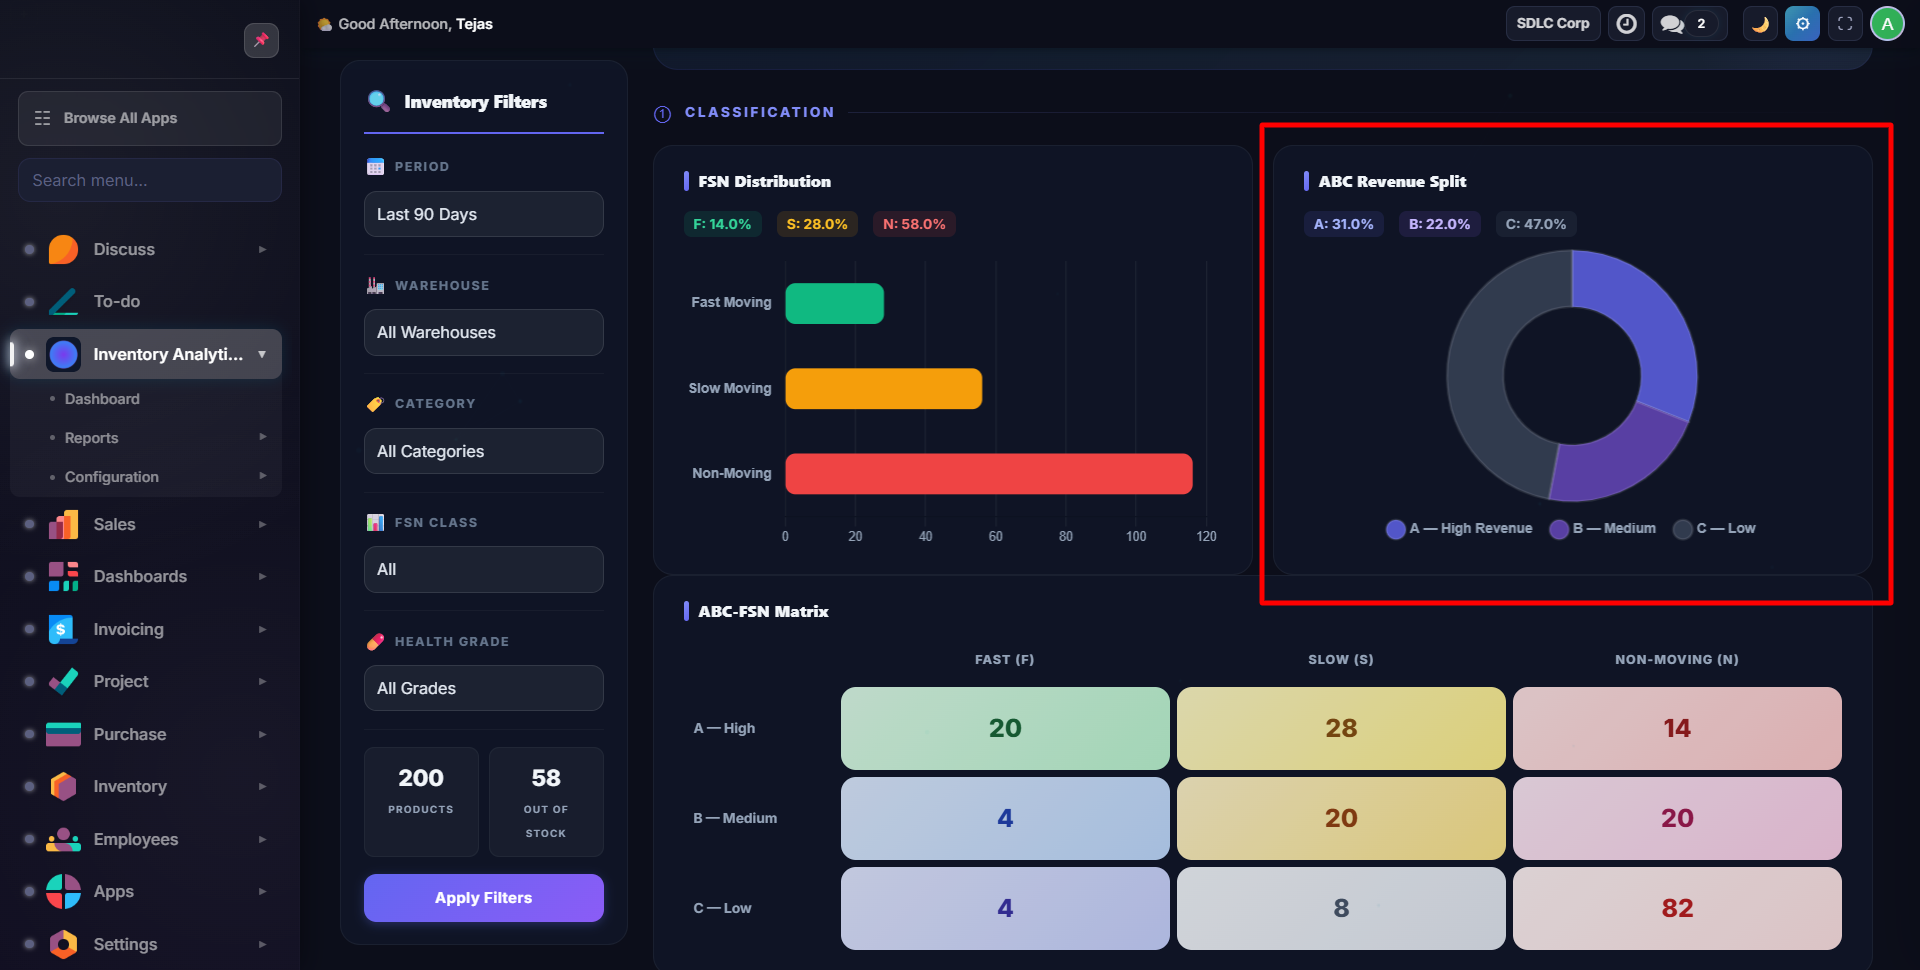
- A: Top 80% cumulative revenue
- B: Next 15% (80-95%)
- C: Bottom 5% (95-100%)
ABC-FSN Matrix
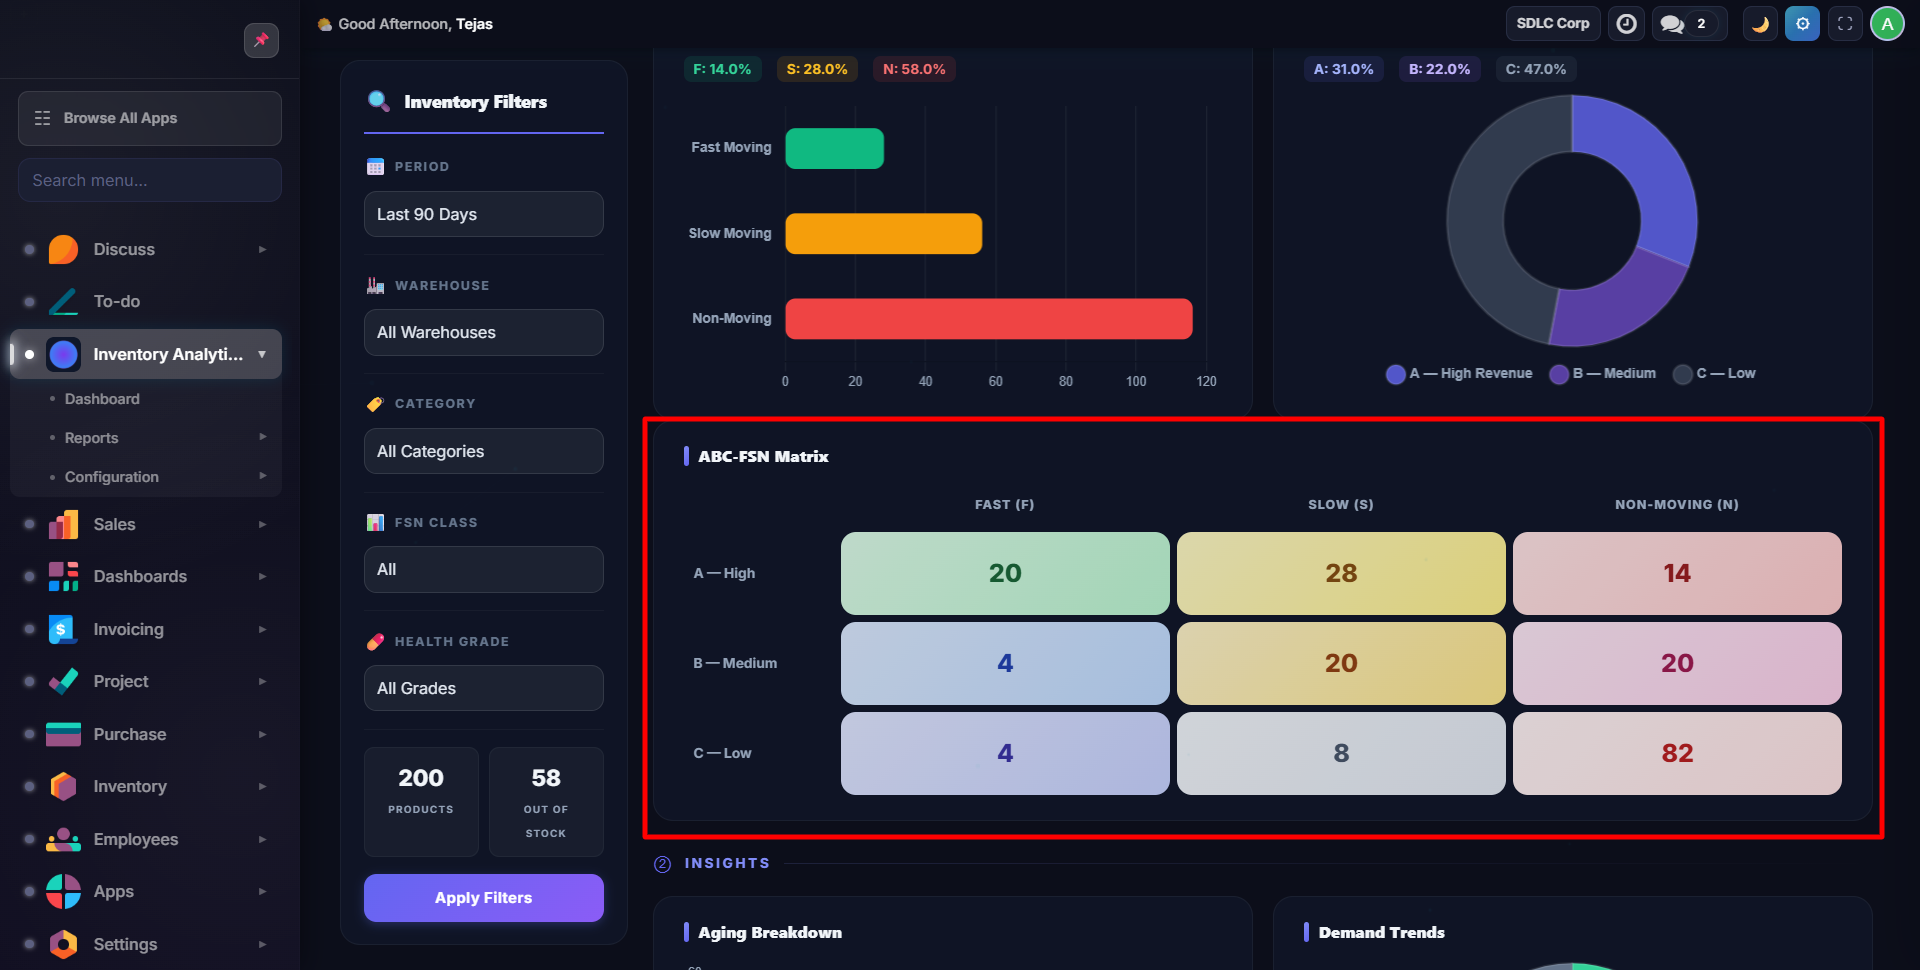
A 3x3 grid combining ABC (revenue) and FSN (movement) classifications to identify strategic product segments.
Insights
Inventory Aging
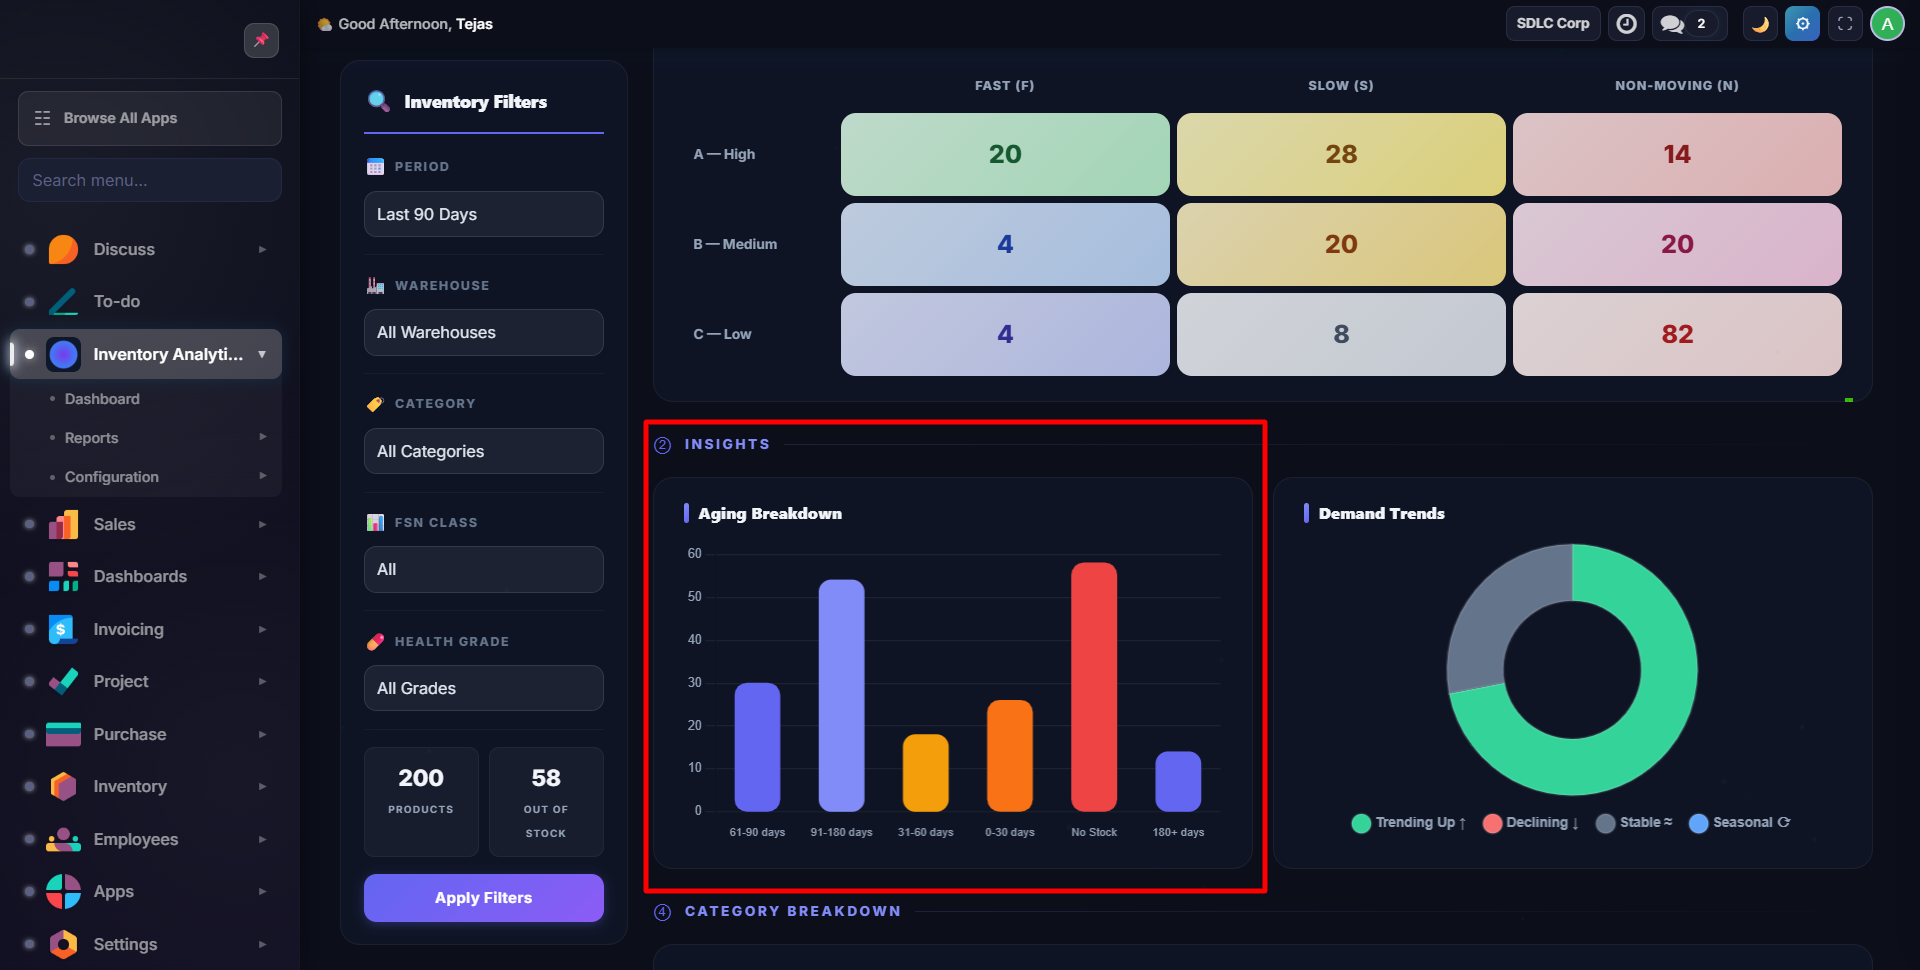
Brackets: 0-30 days, 31-60, 61-90, 91-180, and 180+ days.
Demand Trends
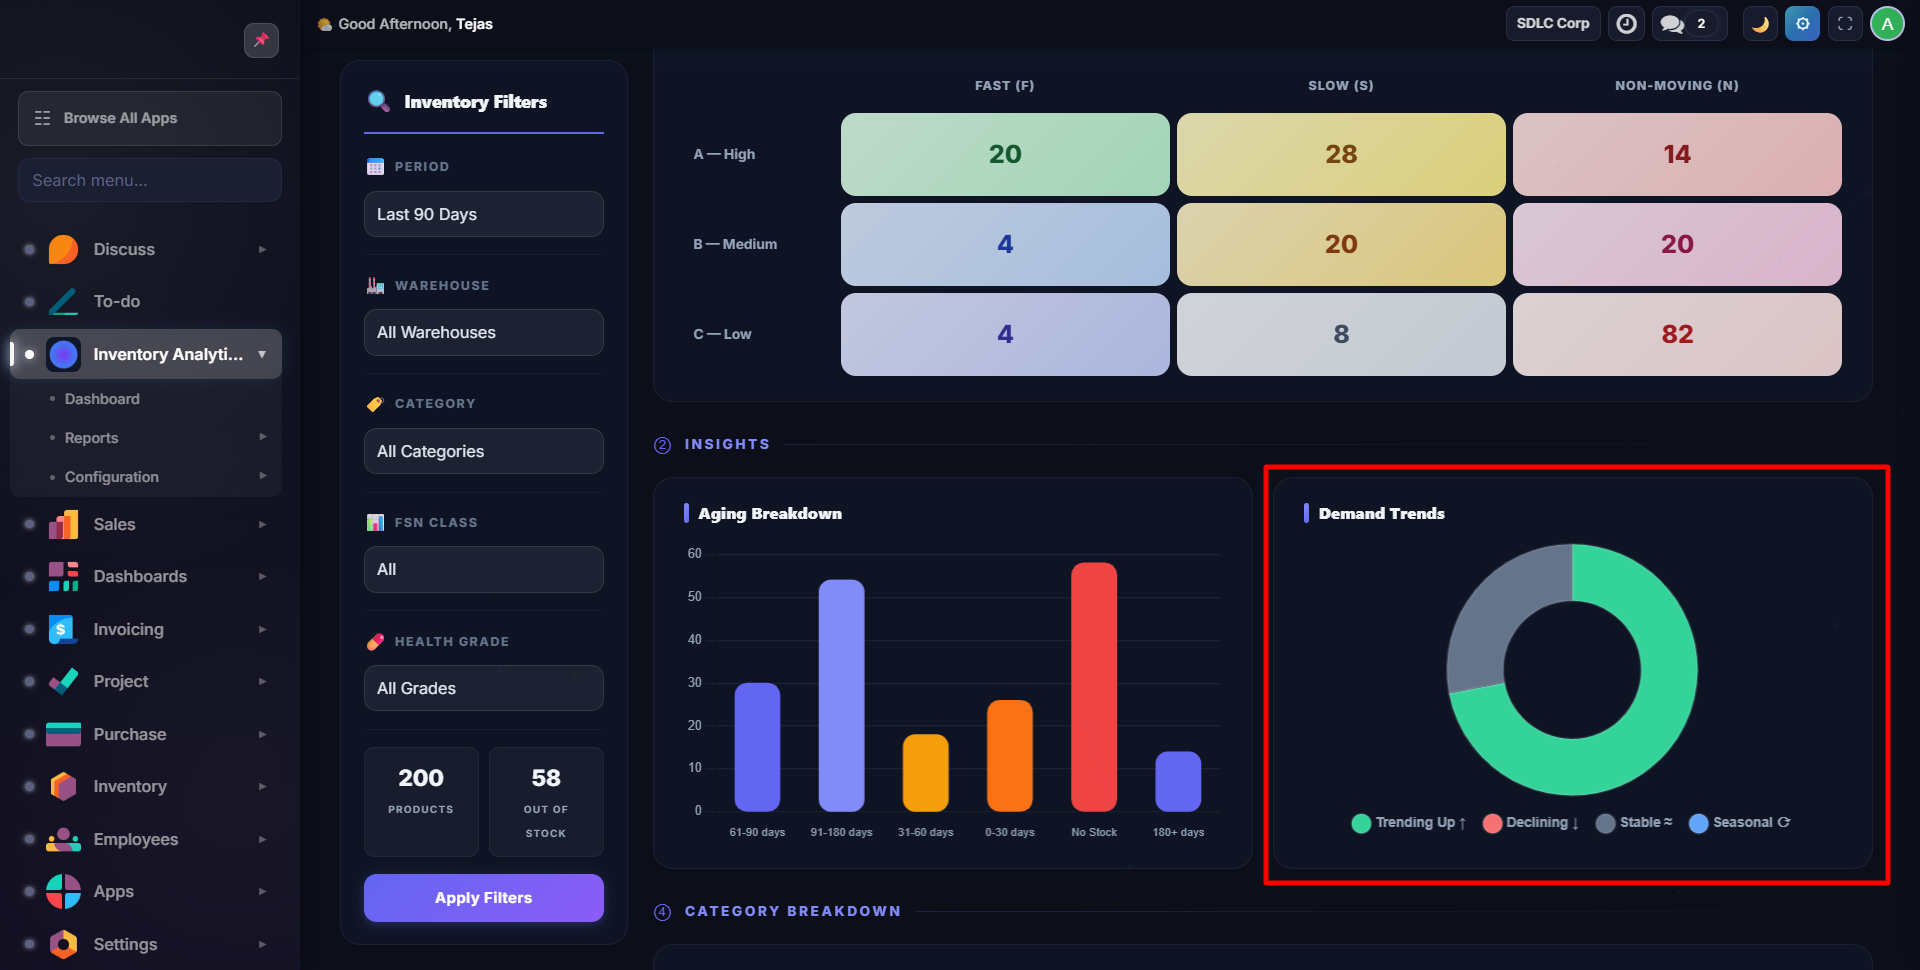
Compares first-half vs second-half period sales to detect direction.
Category-wise FSN
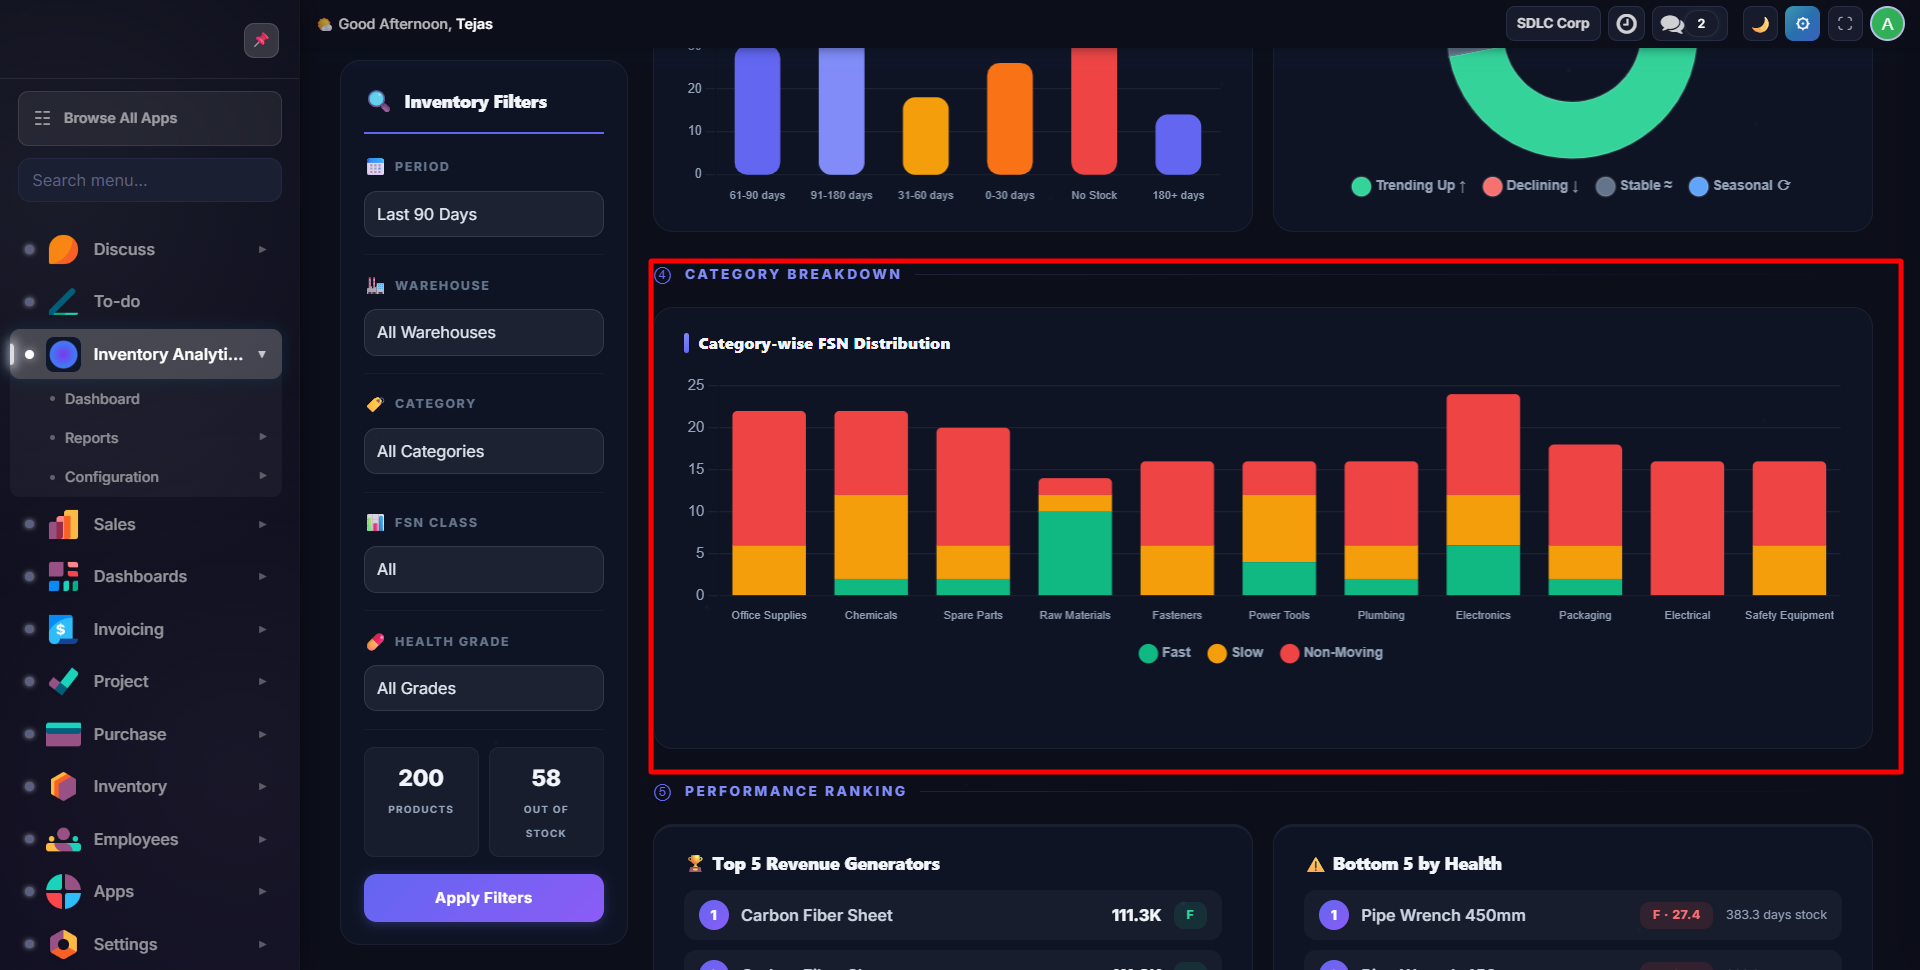
Identifies which product categories have the most non-moving stock.
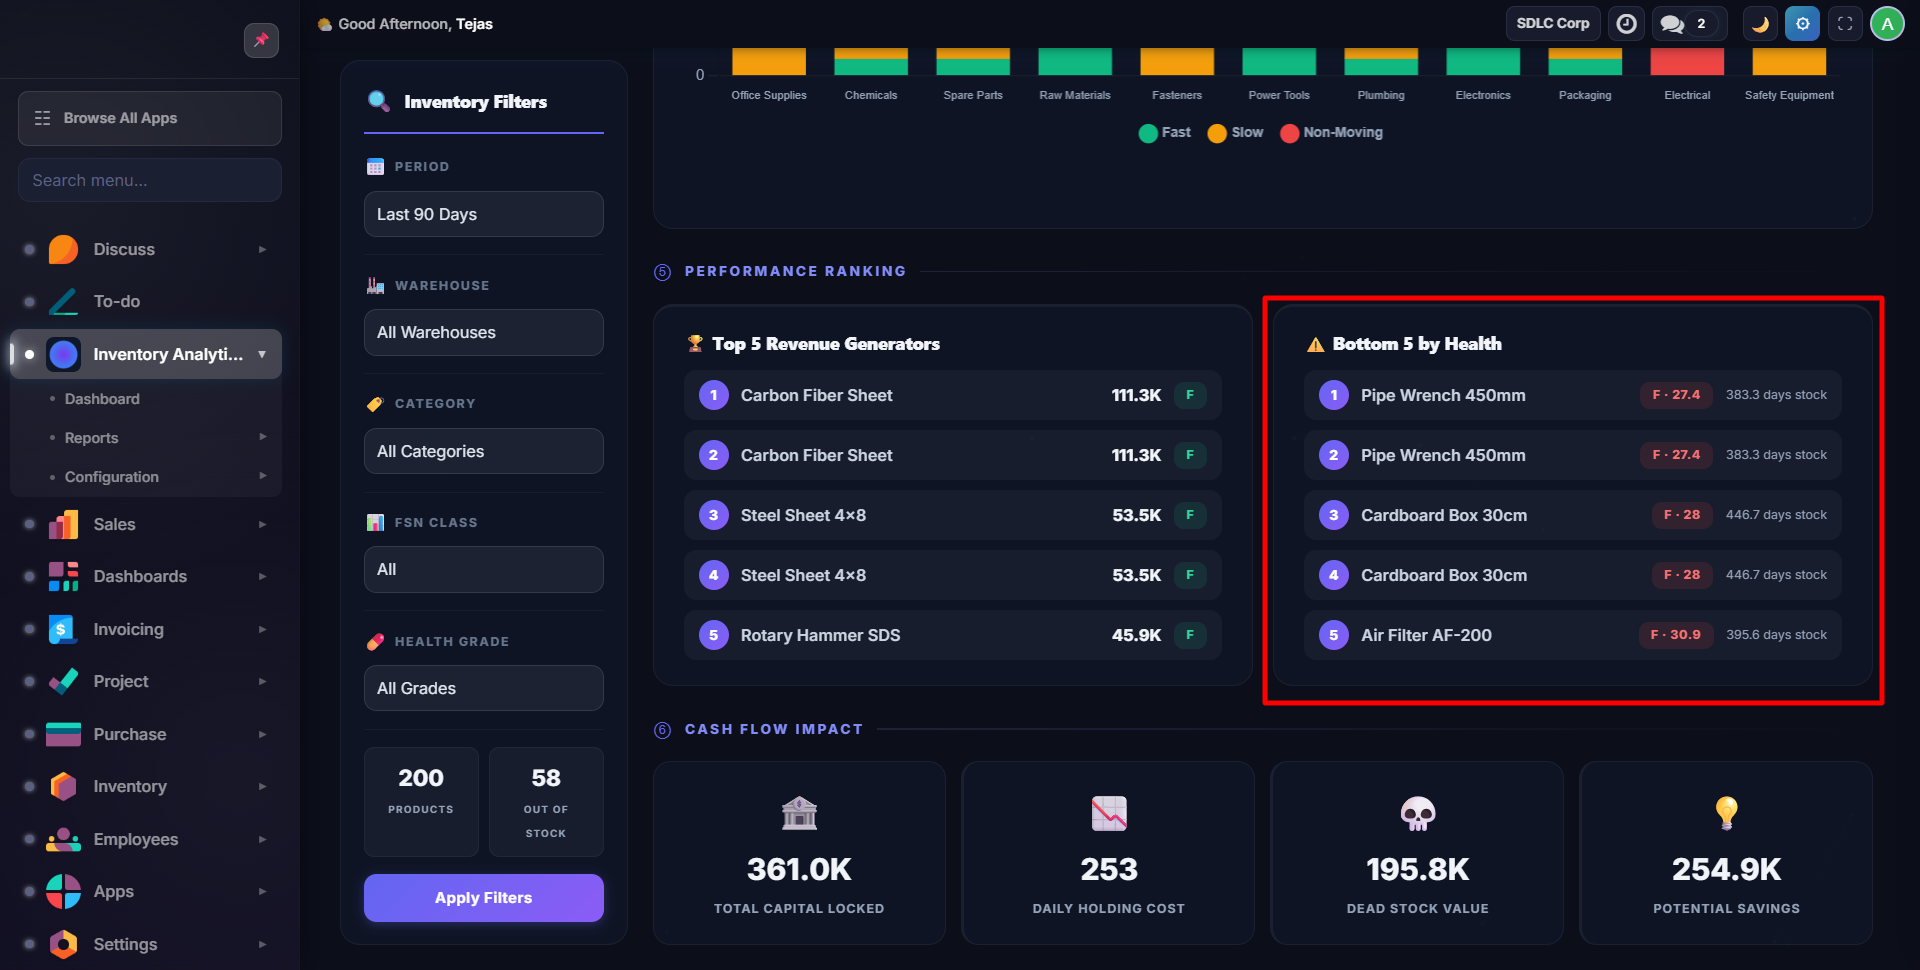
Rankings
Top 5 Revenue Generators:
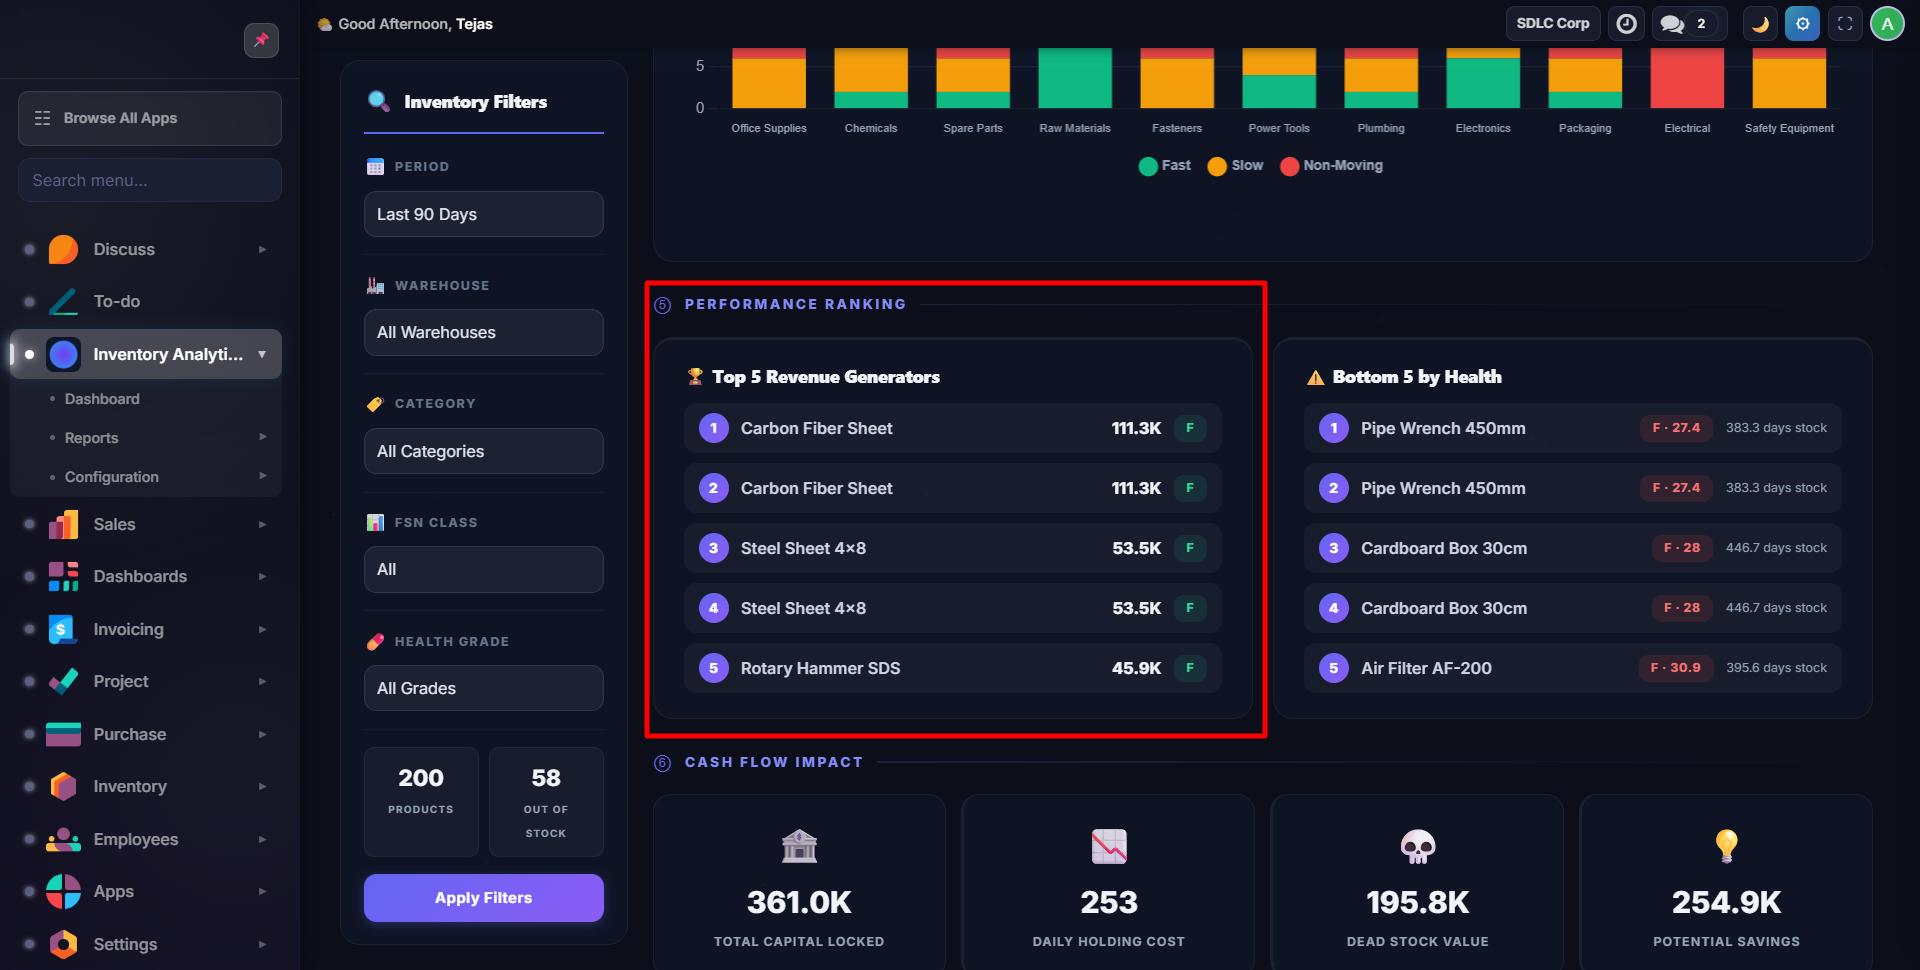
Bottom 5 by Health Score:
Cash Flow Impact
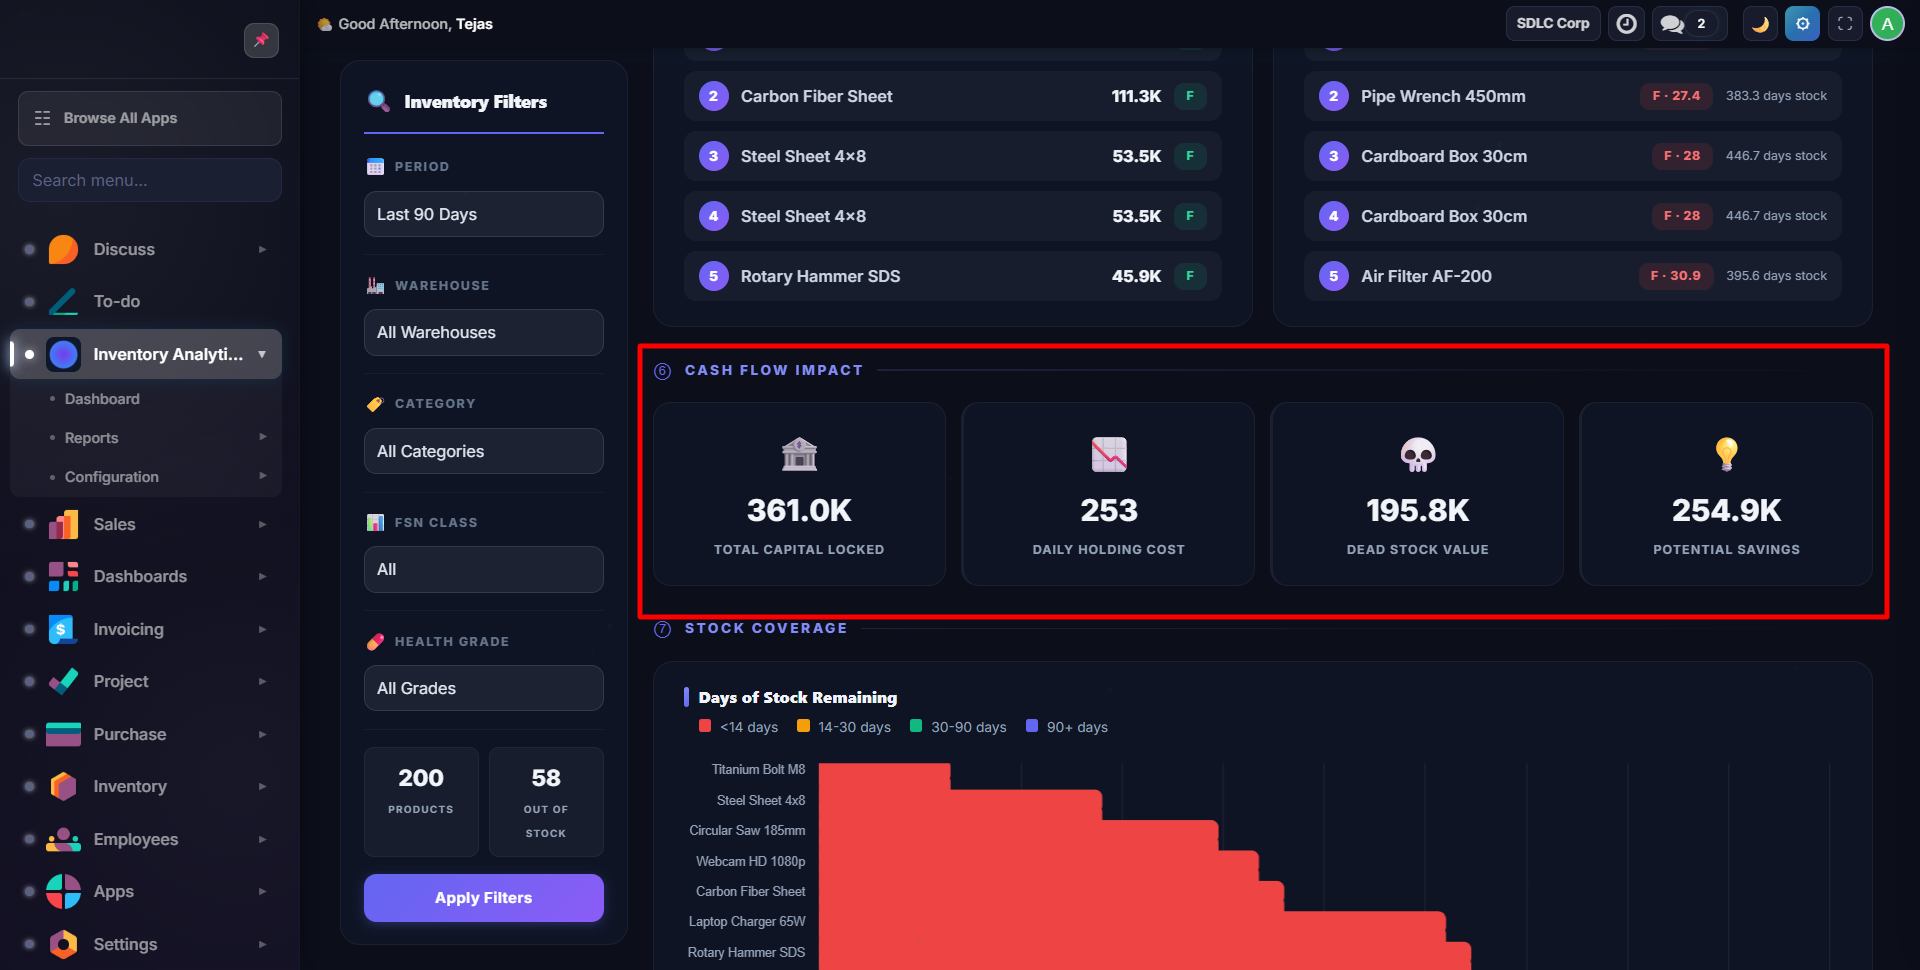
| Metric | Description |
|---|---|
| Capital Locked | Total stock value tied up |
| Daily Holding Cost | ~25% annual carrying cost / 365 |
| Dead Stock Value | Value in non-moving products |
| Potential Savings | Estimated savings if dead/slow stock cleared |
Stock Coverage
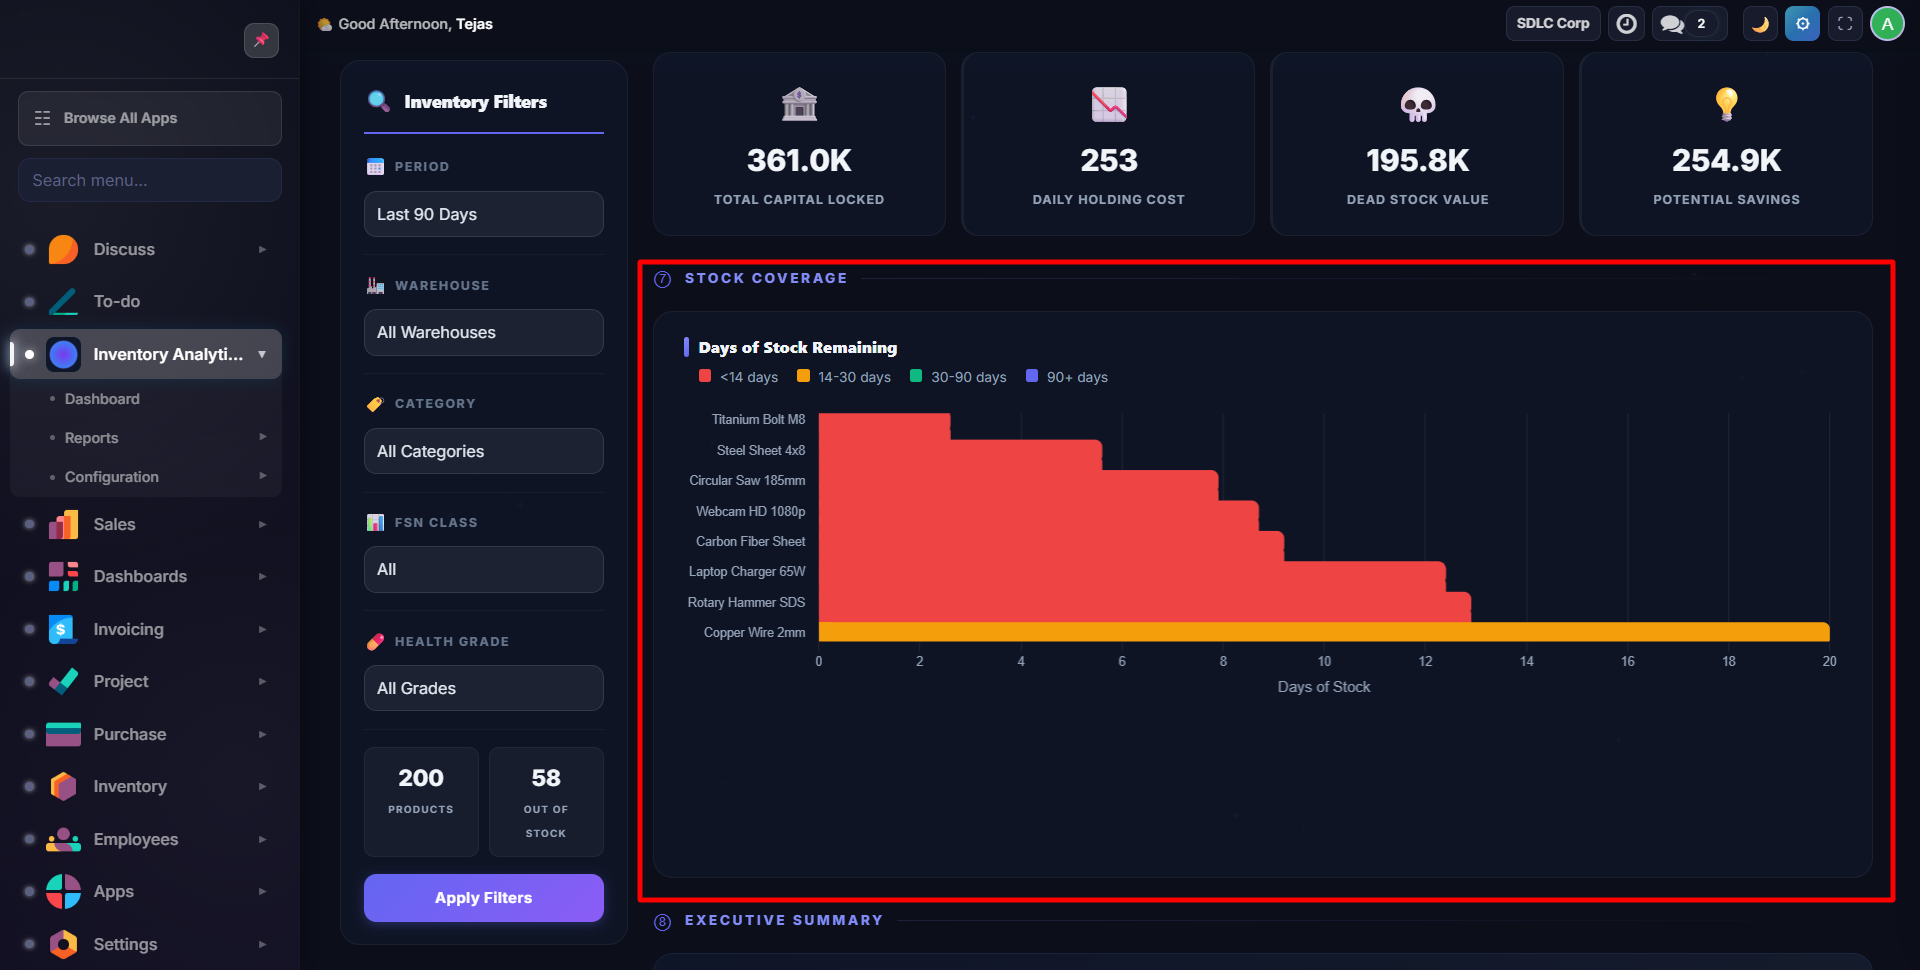
Shows days of stock remaining for the 15 most urgent products. Color: Red (under 14 days), Amber (14-30), Green (30-90), Blue (90+).
Executive Summary
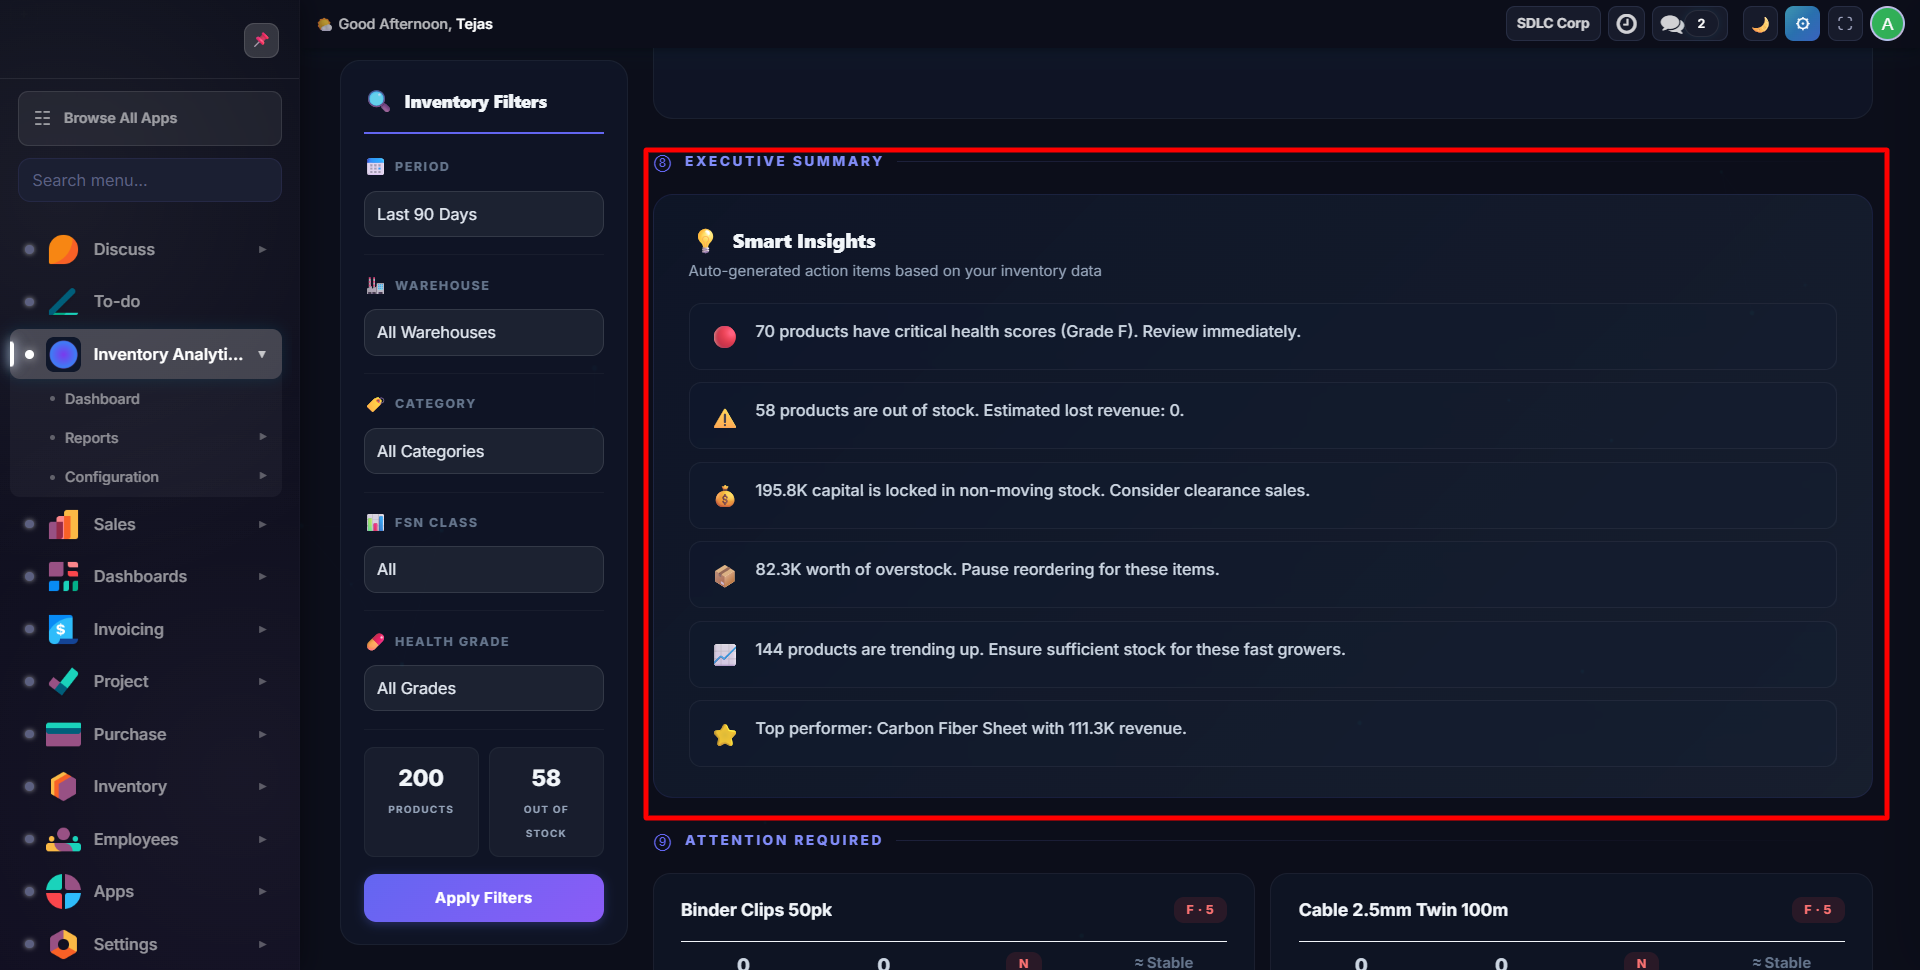
Auto-generated insights highlighting critical issues, growth opportunities, and top performers.
Attention Products
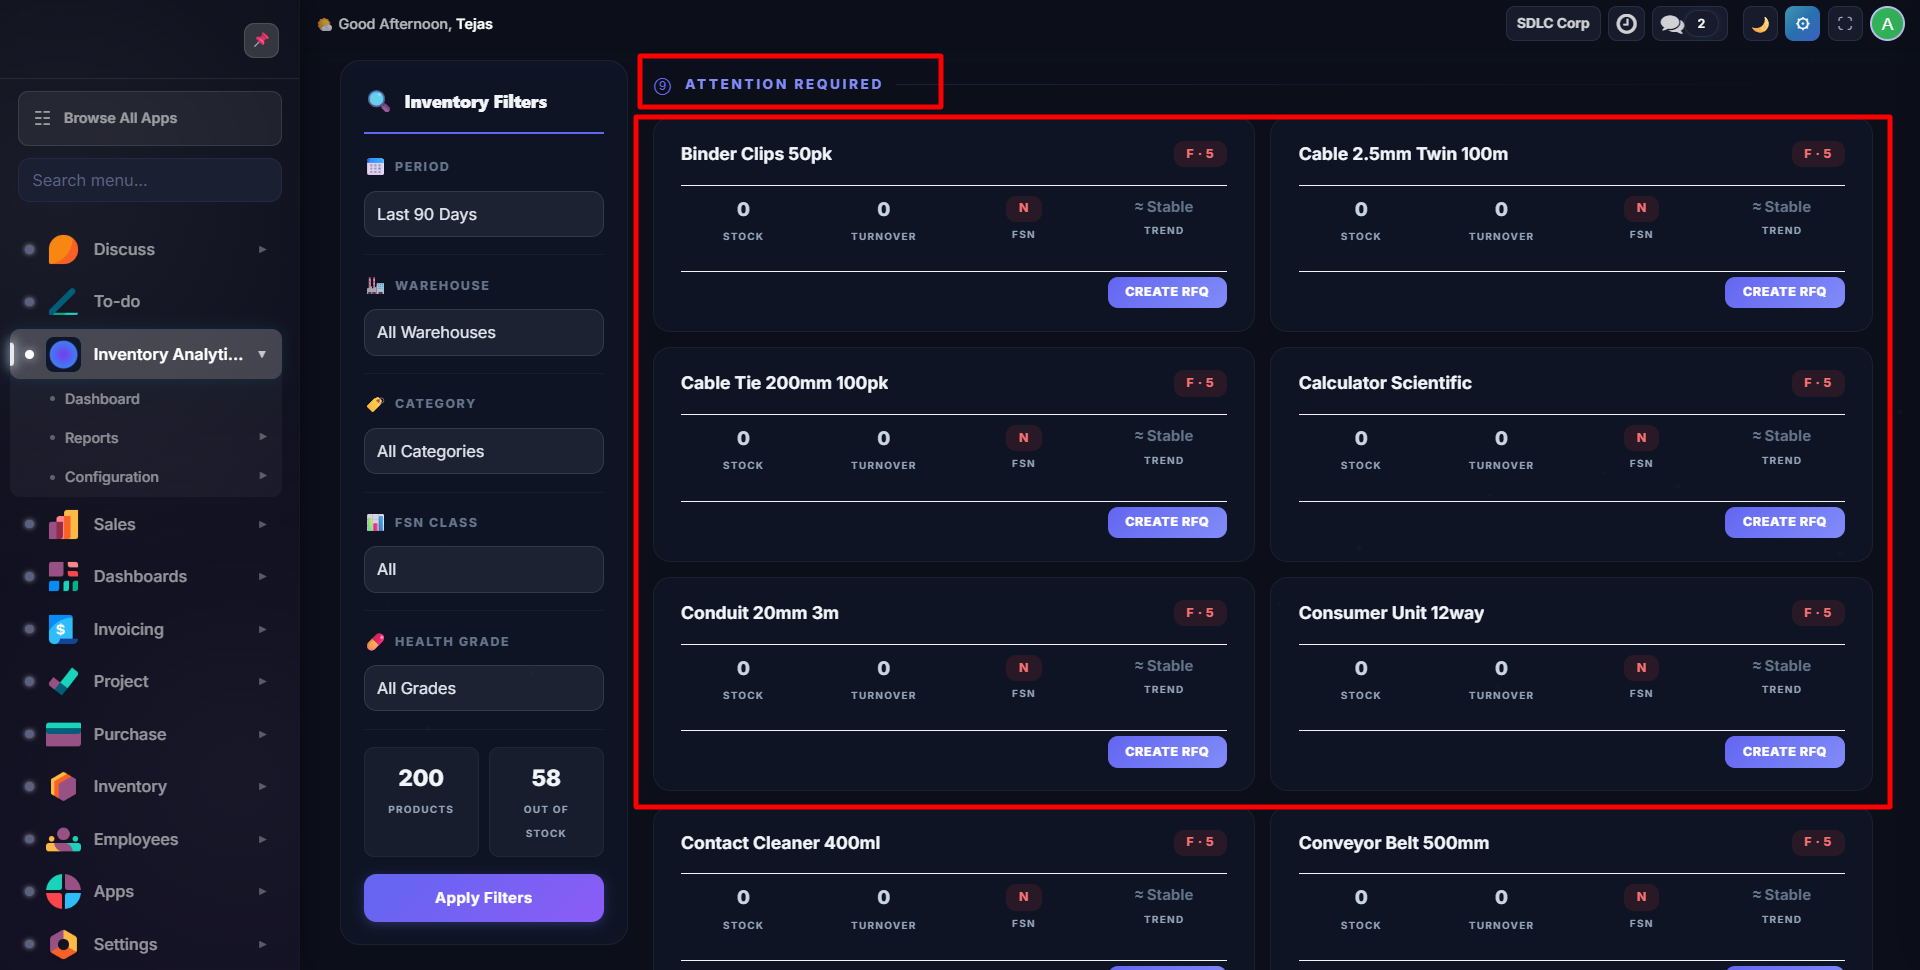
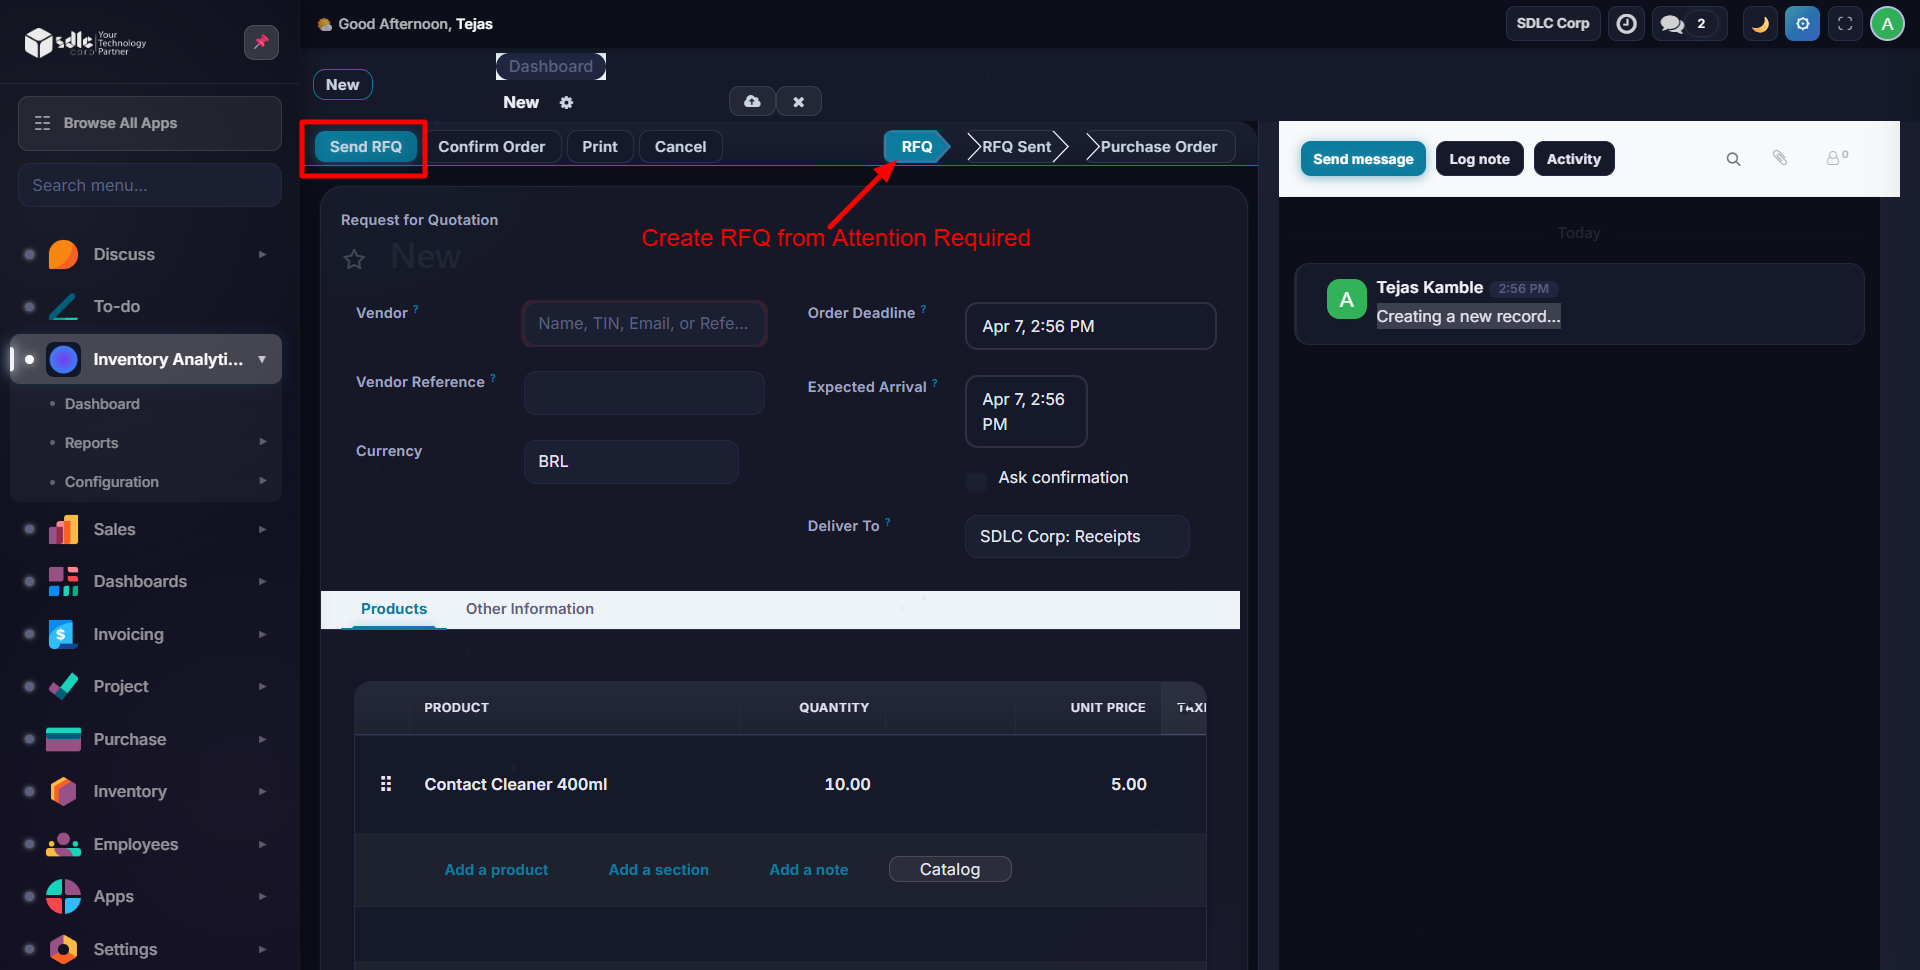
Bottom 10 products by health score. Out-of-stock items show a Create RFQ button:
Contact SDLC Corp at sdlccorp.com/contact-us or email sales@sdlccorp.com