Reports & Excel Export
Report Wizard
Go to Inventory Analytics > Reports > Generate Report to open the wizard:
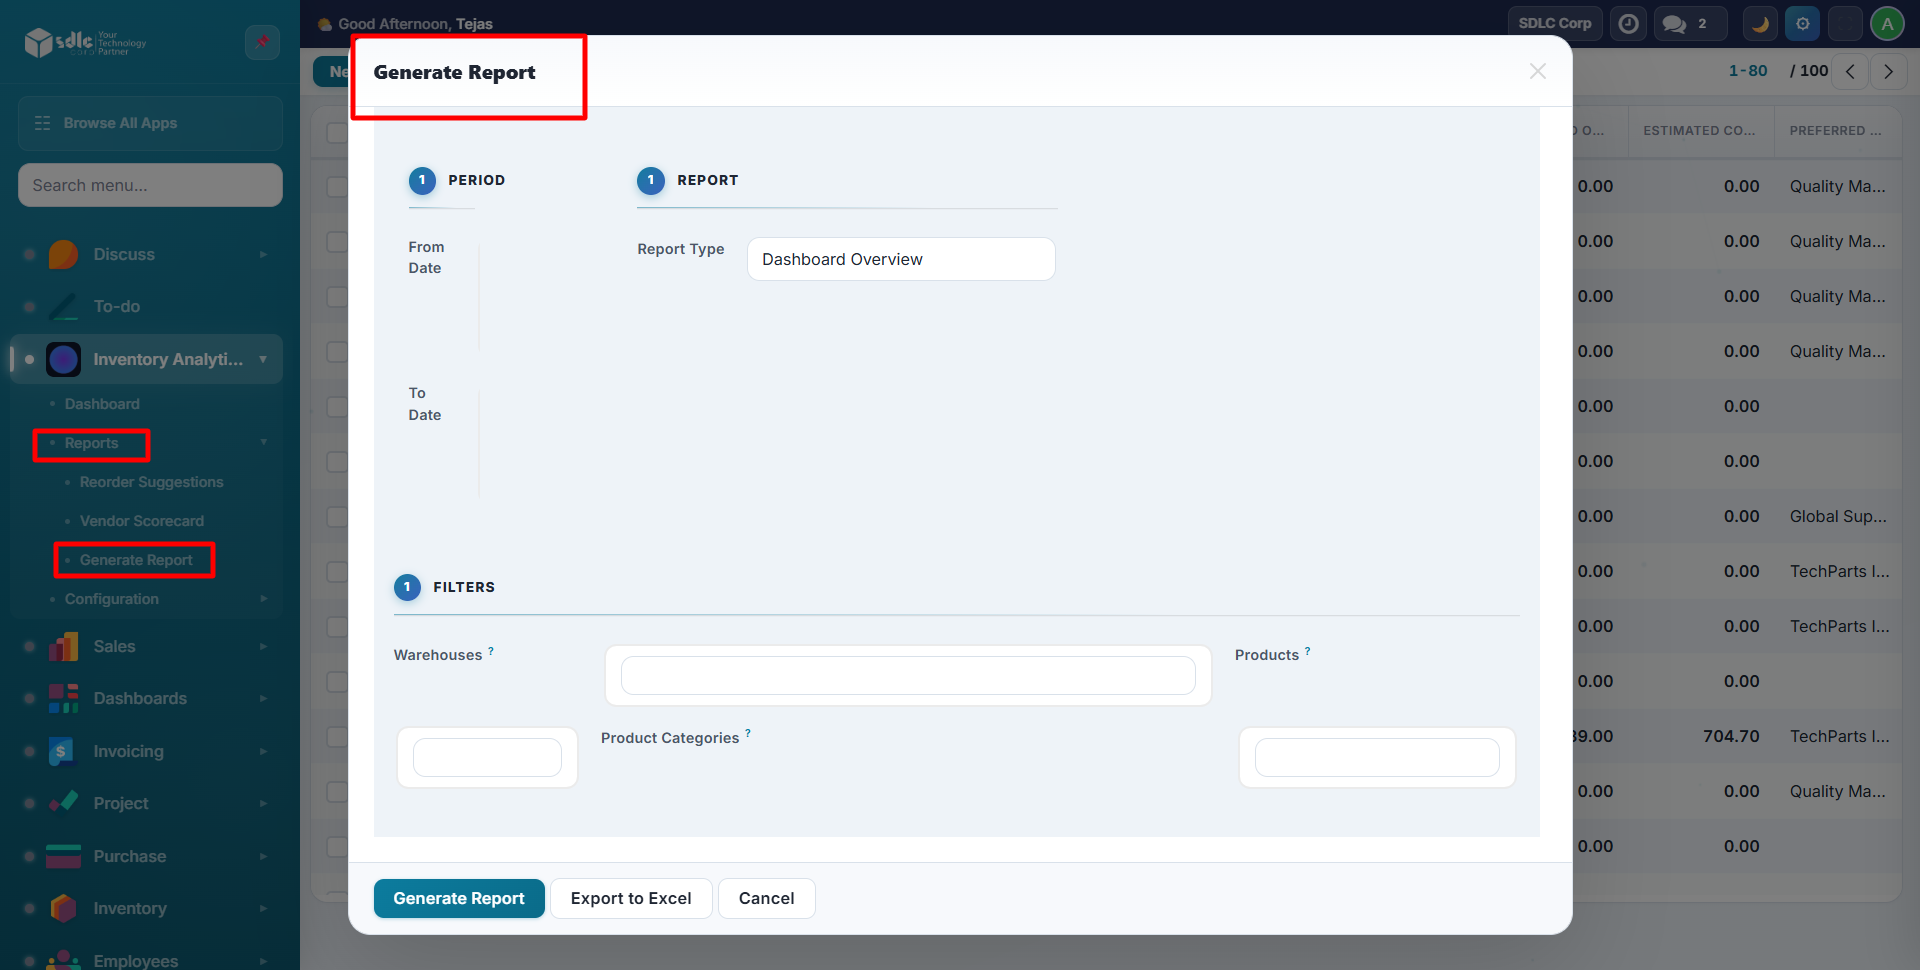
Configuration
| Field | Description |
|---|---|
| From Date | Start of analysis period (default: 90 days ago) |
| To Date | End of analysis period (default: today) |
| Report Type | Select from 10 specialized reports |
| Warehouses | Filter by warehouse (leave empty for all) |
| Products | Filter by specific products |
| Product Categories | Filter by category |
10 Report Types
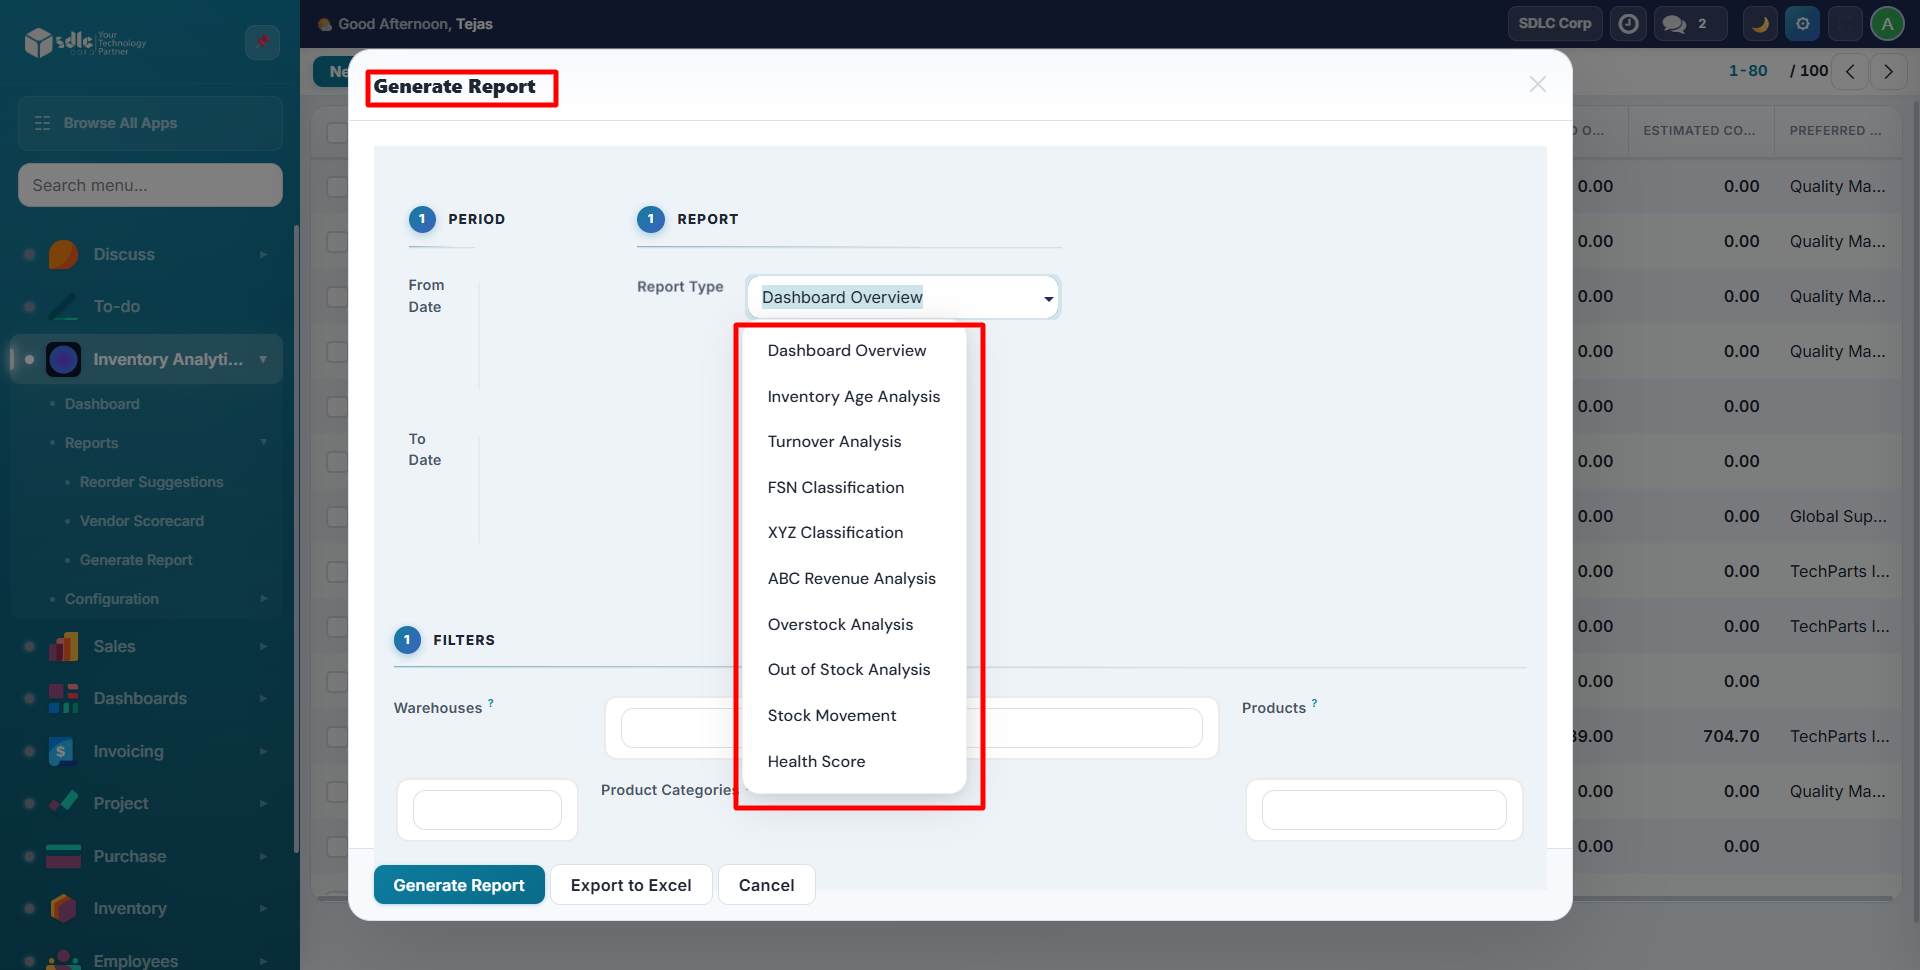
| Report | Purpose | Key Columns |
|---|---|---|
| Dashboard Overview | Opens interactive dashboard | Charts & KPIs |
| Health Score | Composite health grading | Score, Grade, Days Left |
| Age Analysis | Stock aging breakdown | Oldest Days, Bracket |
| Turnover Analysis | Sales velocity metrics | Opening, Closing, Margin |
| FSN Classification | Movement speed classification | FSN, Trend, Sold |
| XYZ Classification | Stock value classification | XYZ, Value, ABC |
| ABC Revenue | Revenue contribution ranking | Revenue, Share %, ABC |
| Overstock Analysis | Excess inventory identification | Overstock Qty/Value |
| Out of Stock | Stockout analysis | Days OOS, Lost Revenue |
| Stock Movement | In/out/transfer tracking | In, Out, Internal, Adjustments |
Report Examples
Health Score Report
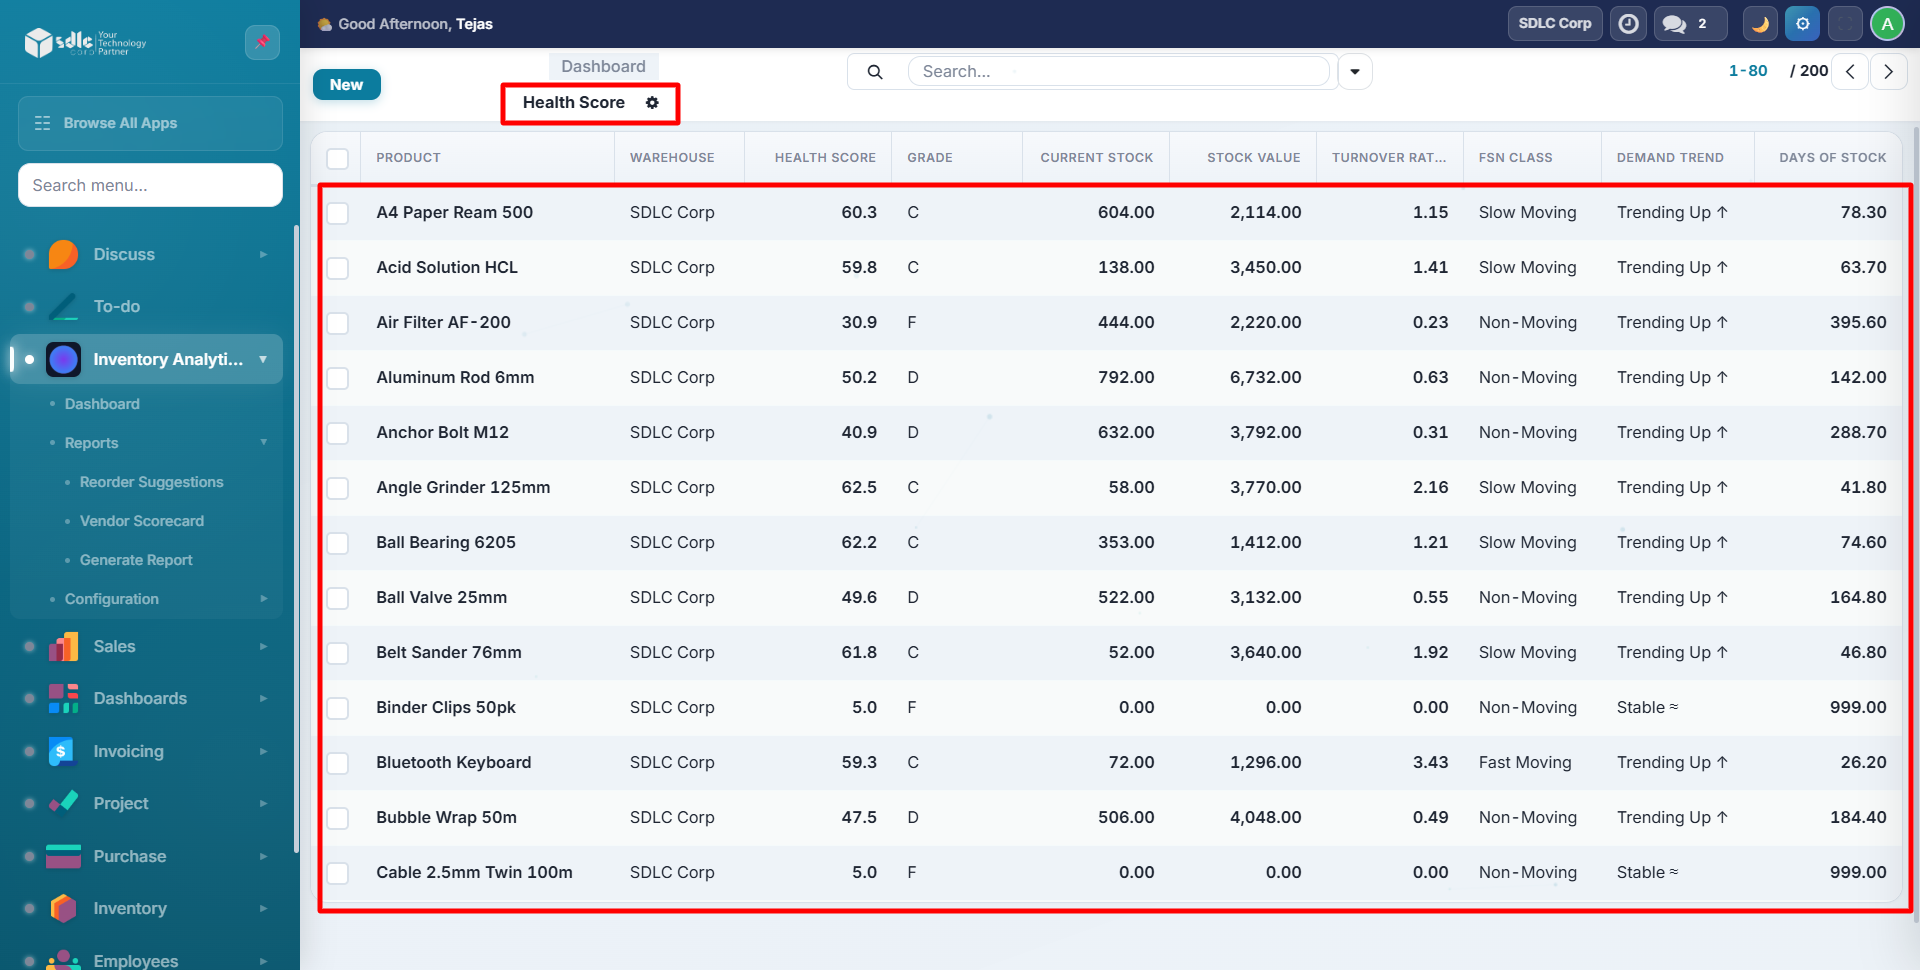
Color-coded rows: Green (A), Yellow (C/D), Red (F).
FSN Classification
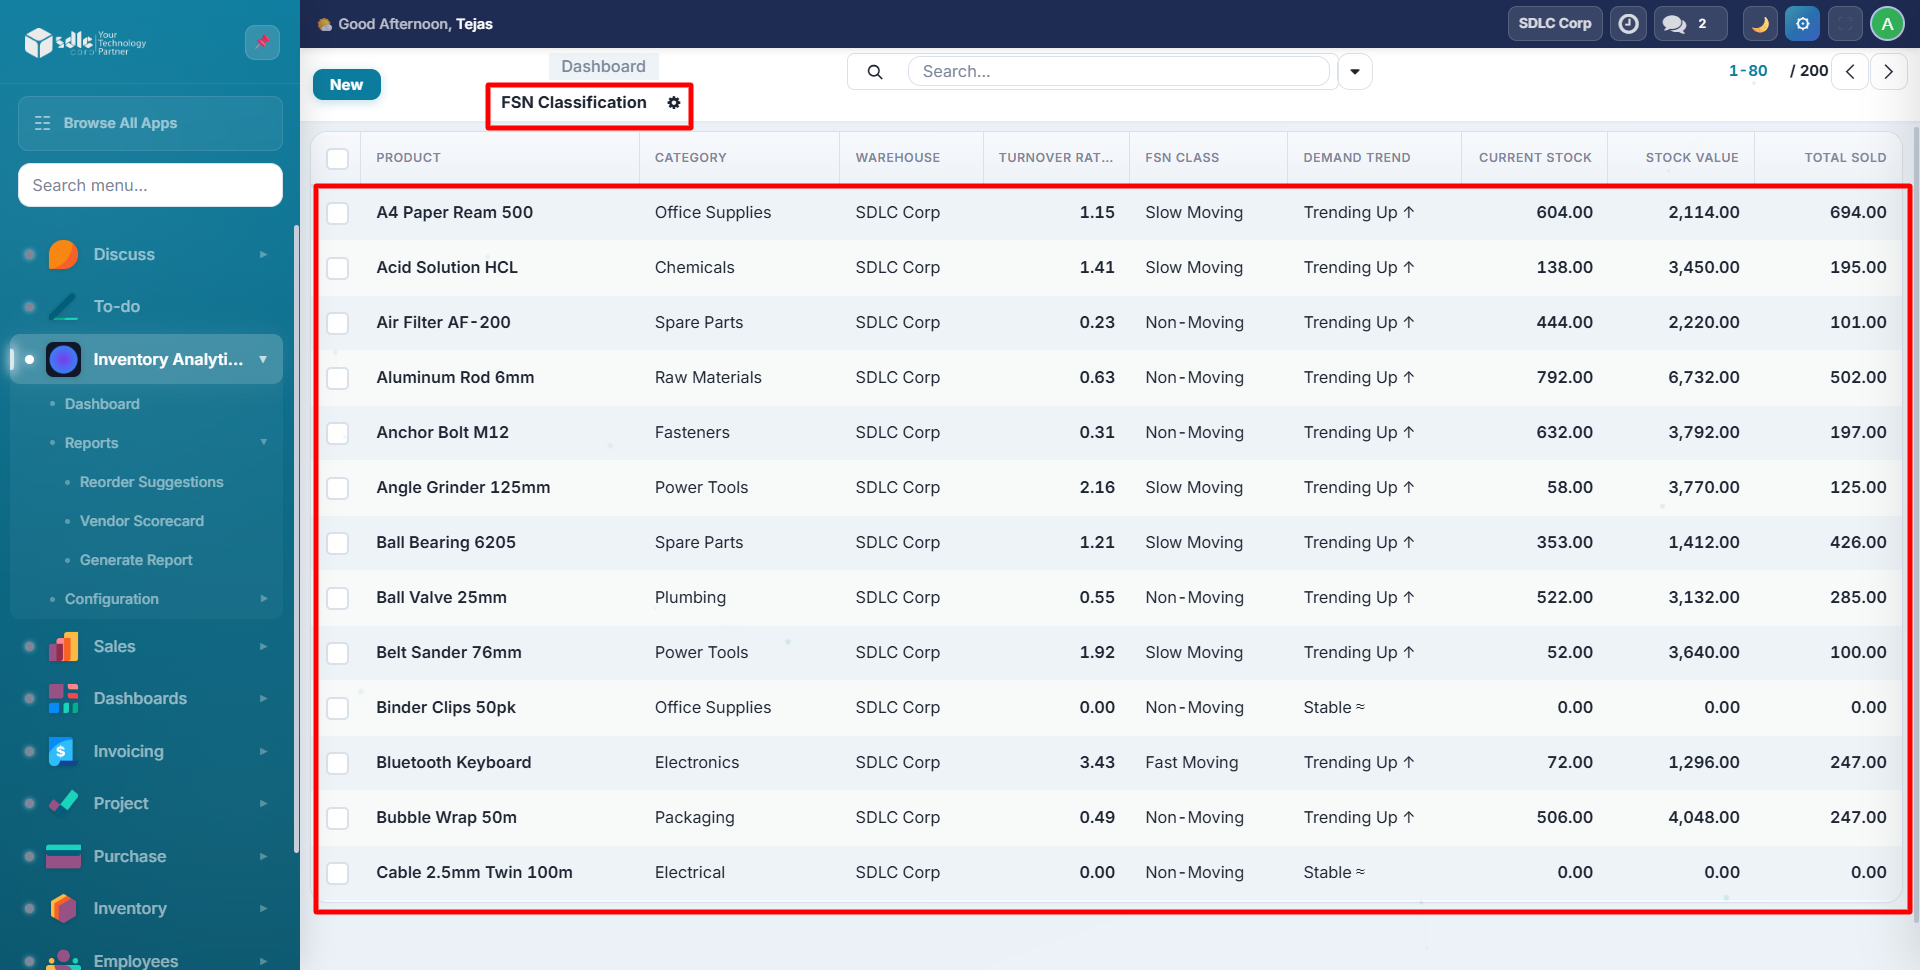
Green = Fast Moving, Yellow = Slow Moving, Red = Non-Moving.
ABC Revenue
Shows revenue share per product with cumulative ABC classification.
Overstock Analysis
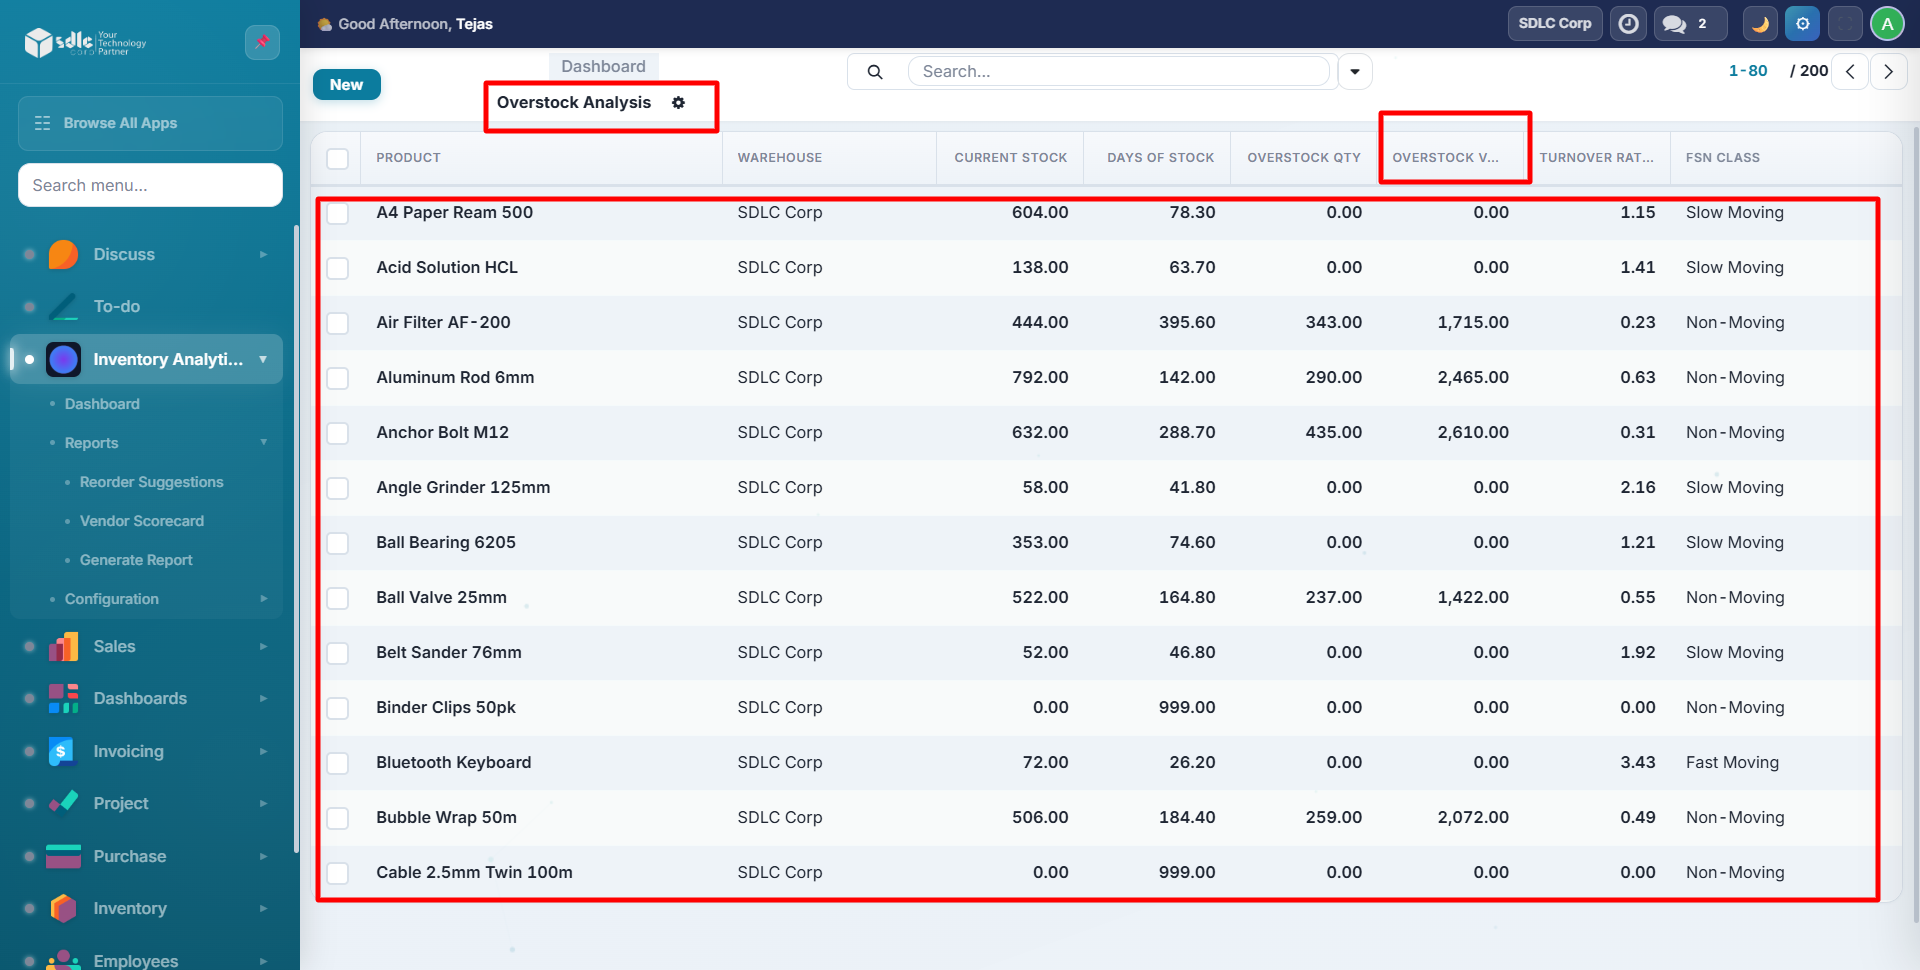
Red rows indicate products with overstock quantity > 0.
Stock Movement
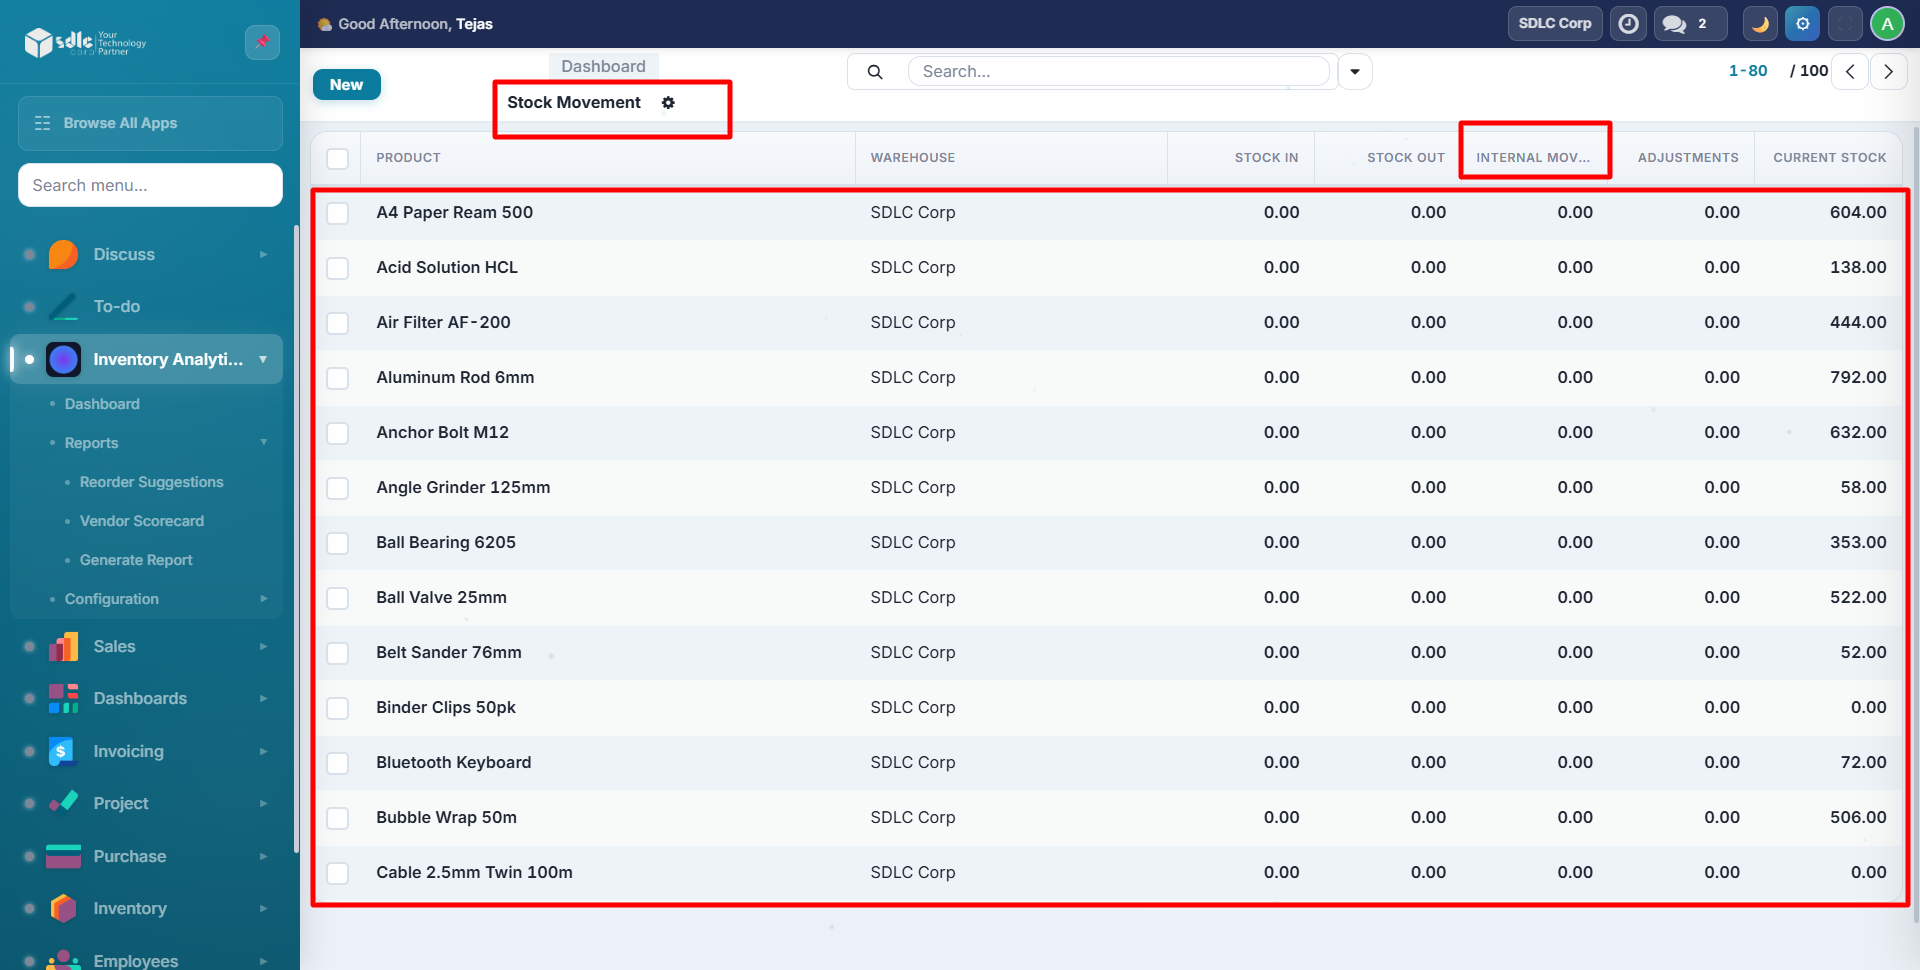
Tracks all stock flows: inbound, outbound, internal transfers, and adjustments.
Turnover Analysis
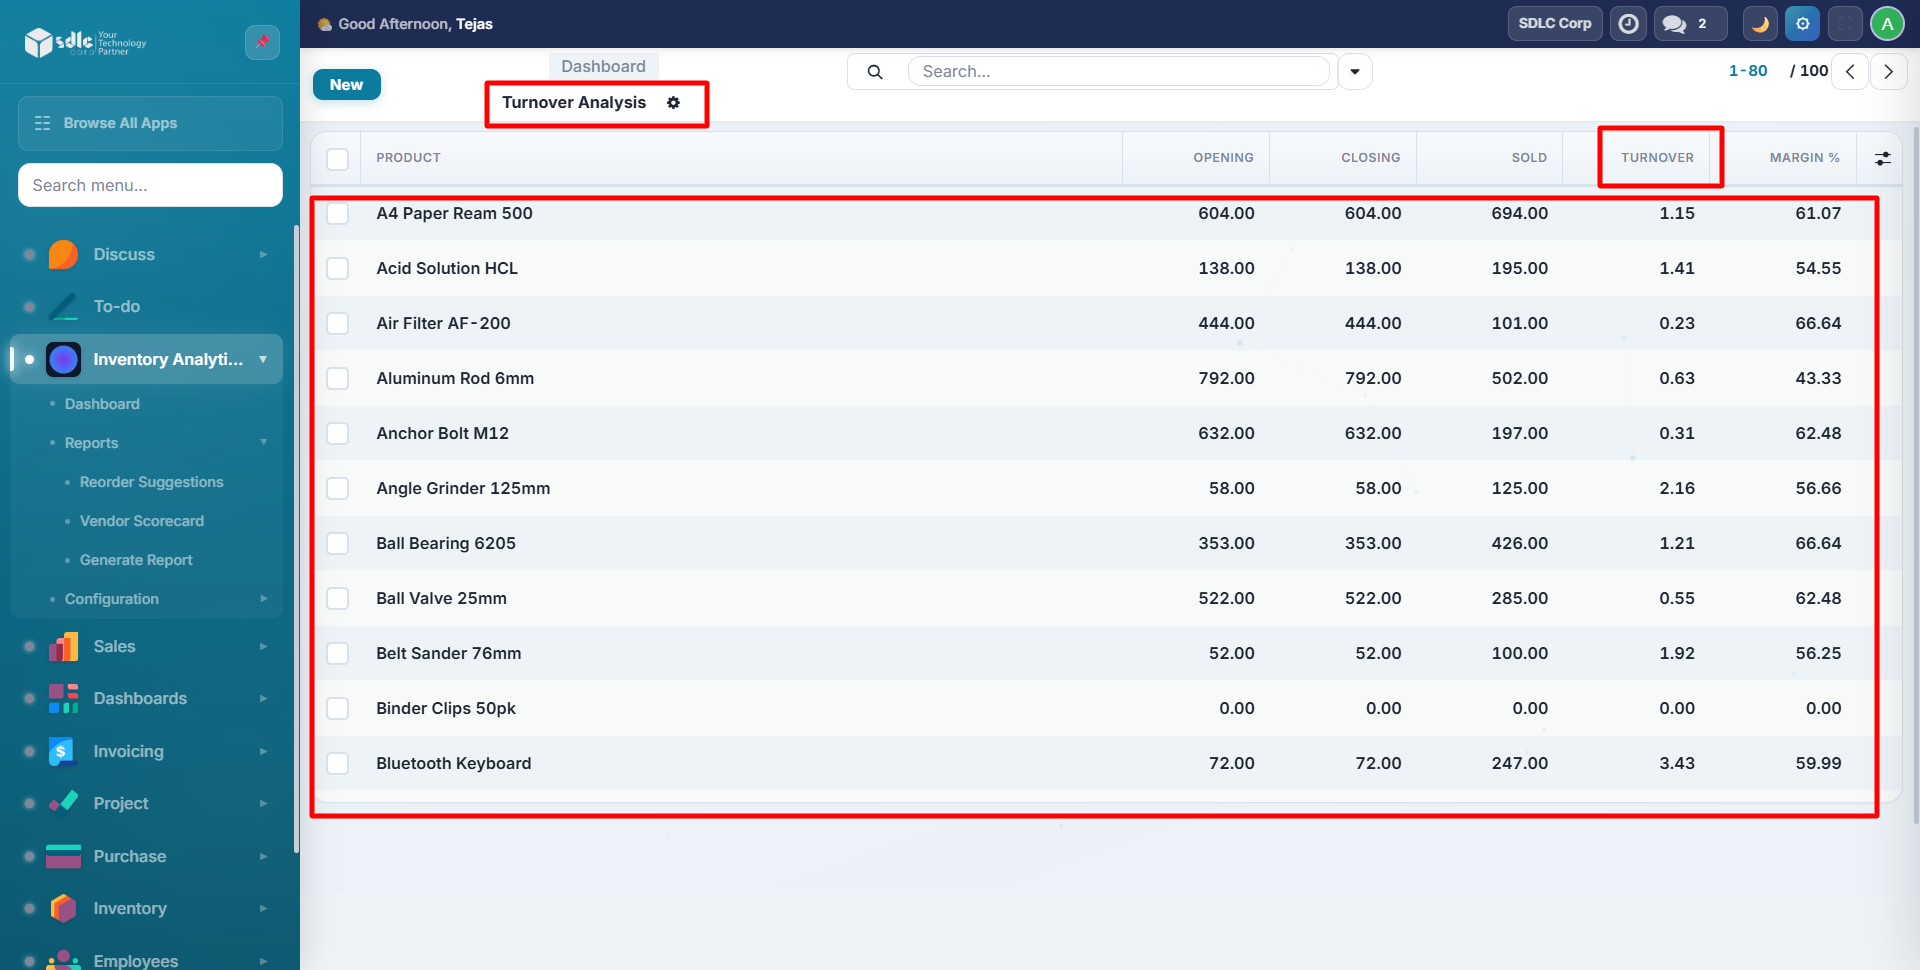
Red rows = turnover below 1 (slow), Green rows = turnover above 3 (fast).
Age Analysis
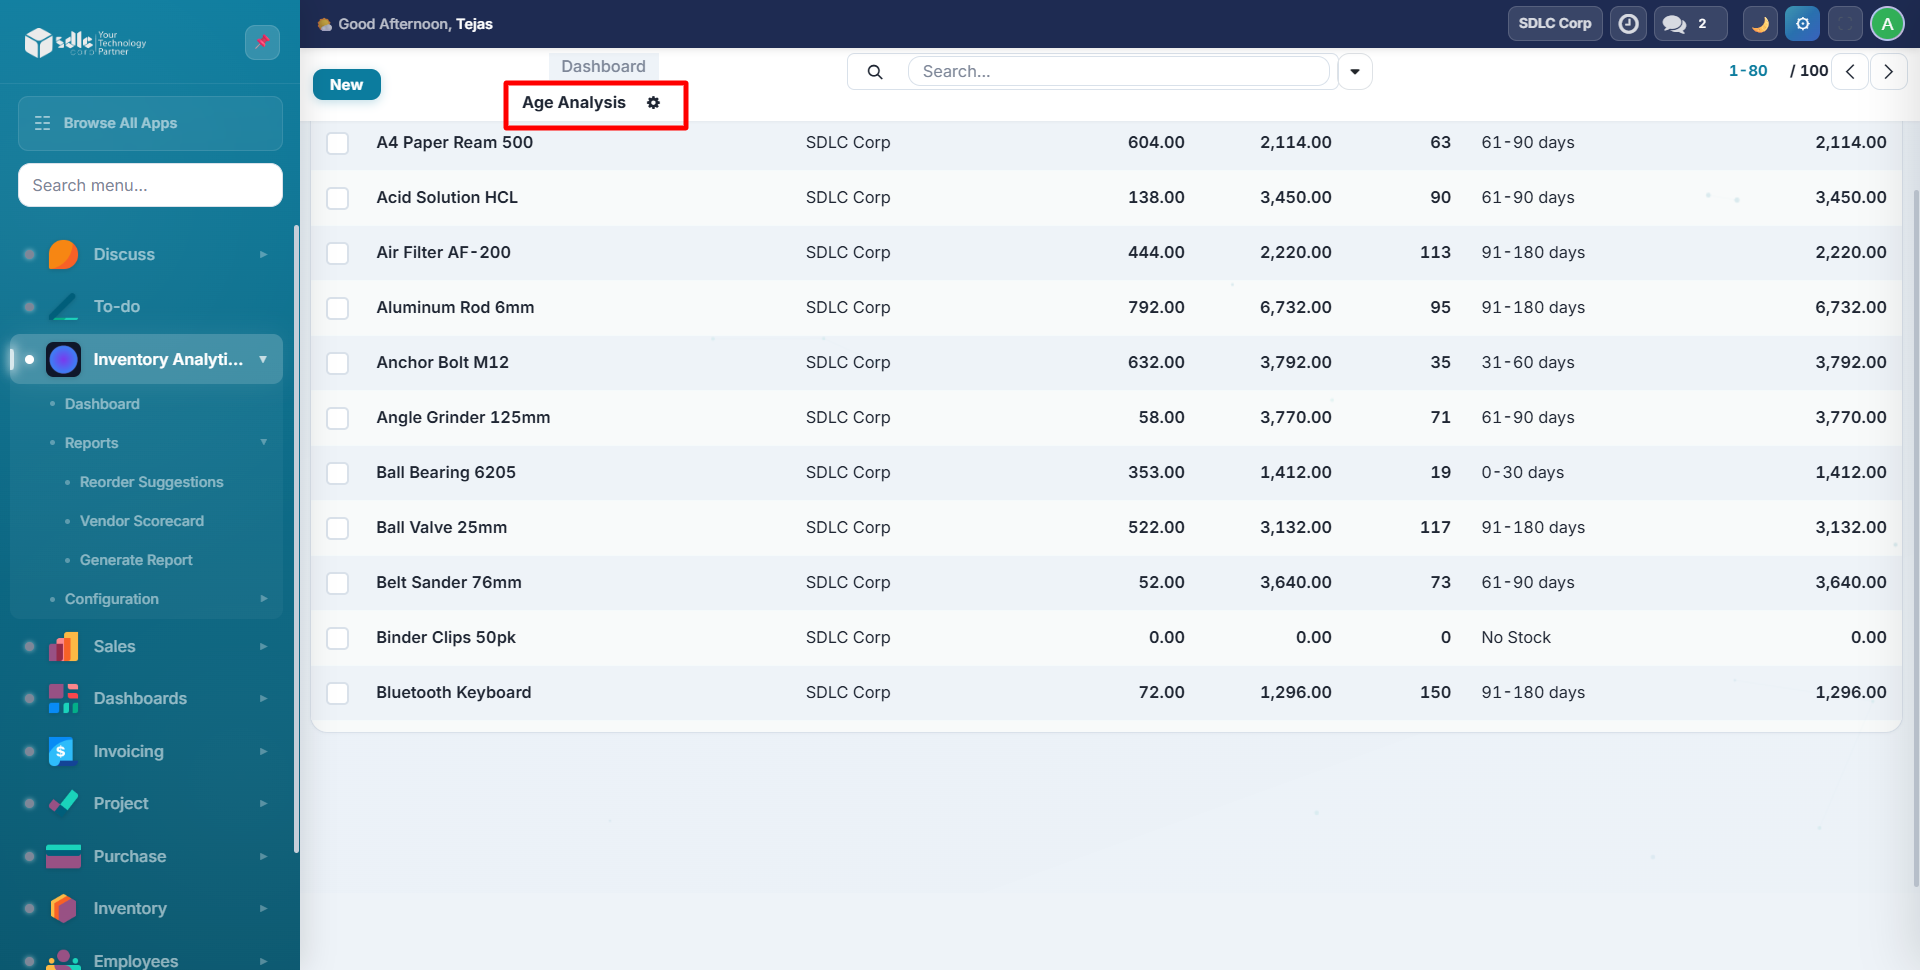
XYZ Classification
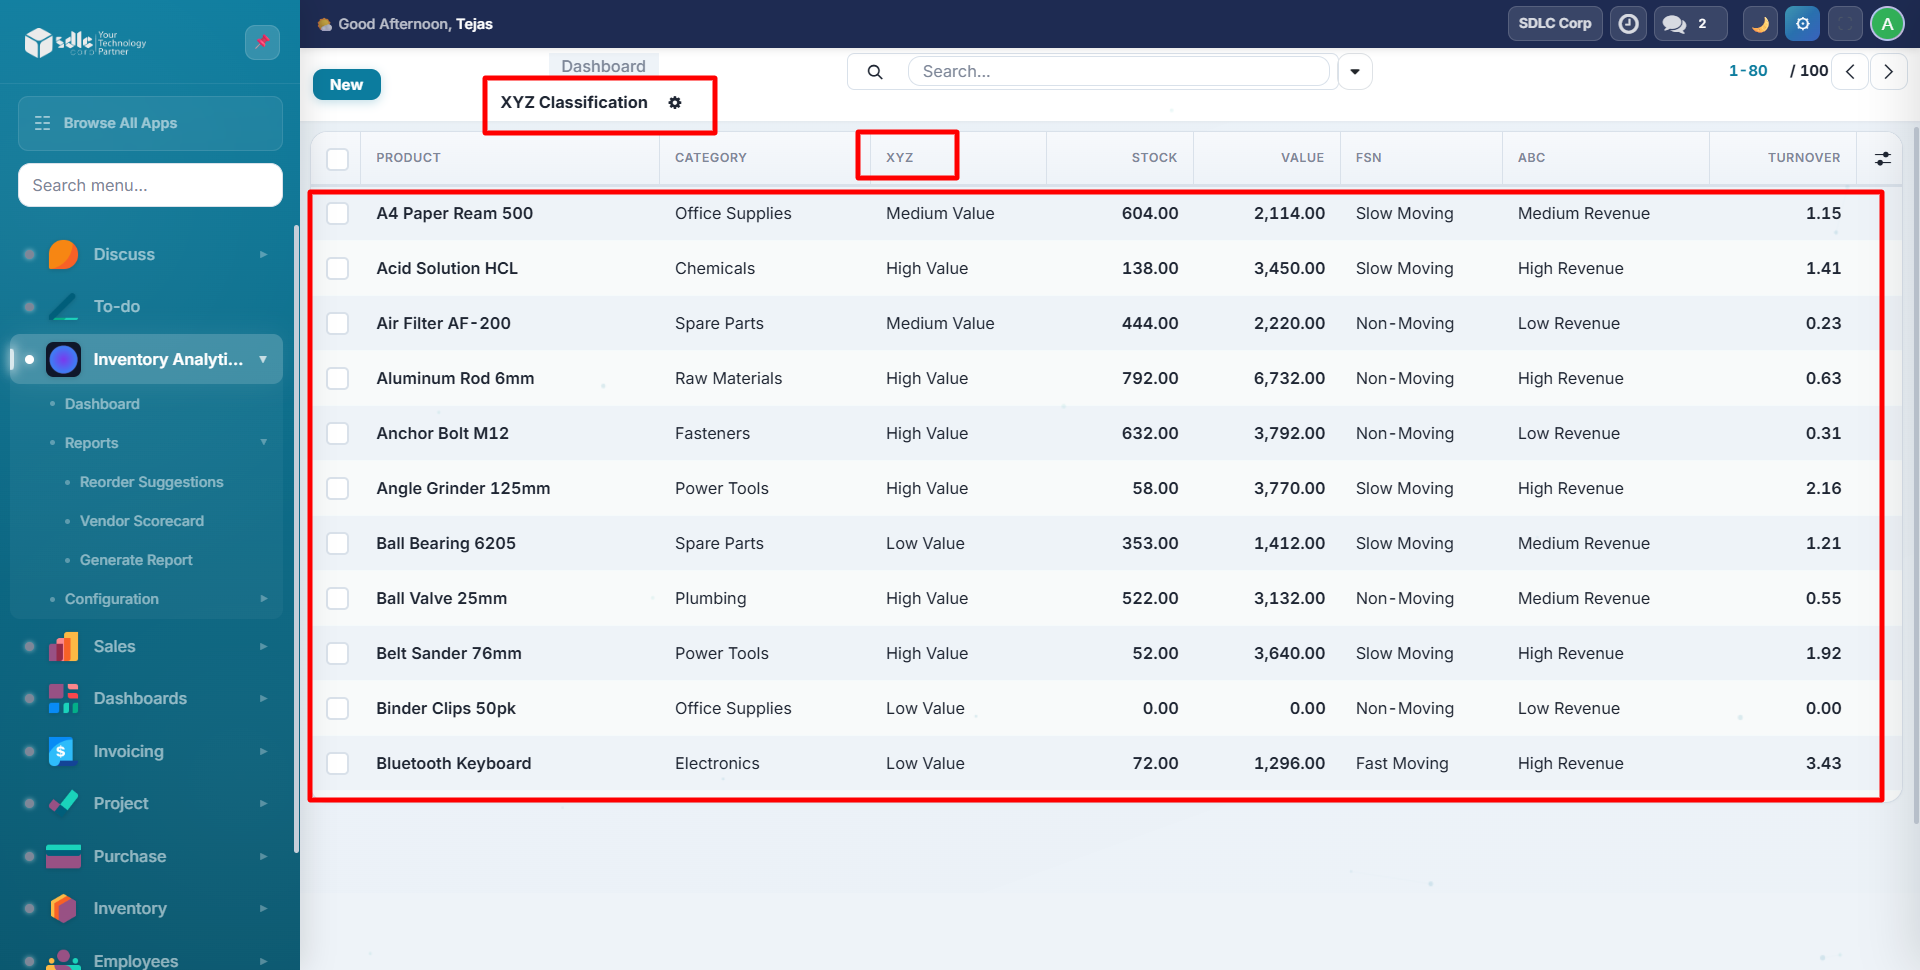
Green = X (high value), Yellow = Y (medium).
Excel Export
From the wizard, click Export to Excel to download a formatted multi-sheet workbook:
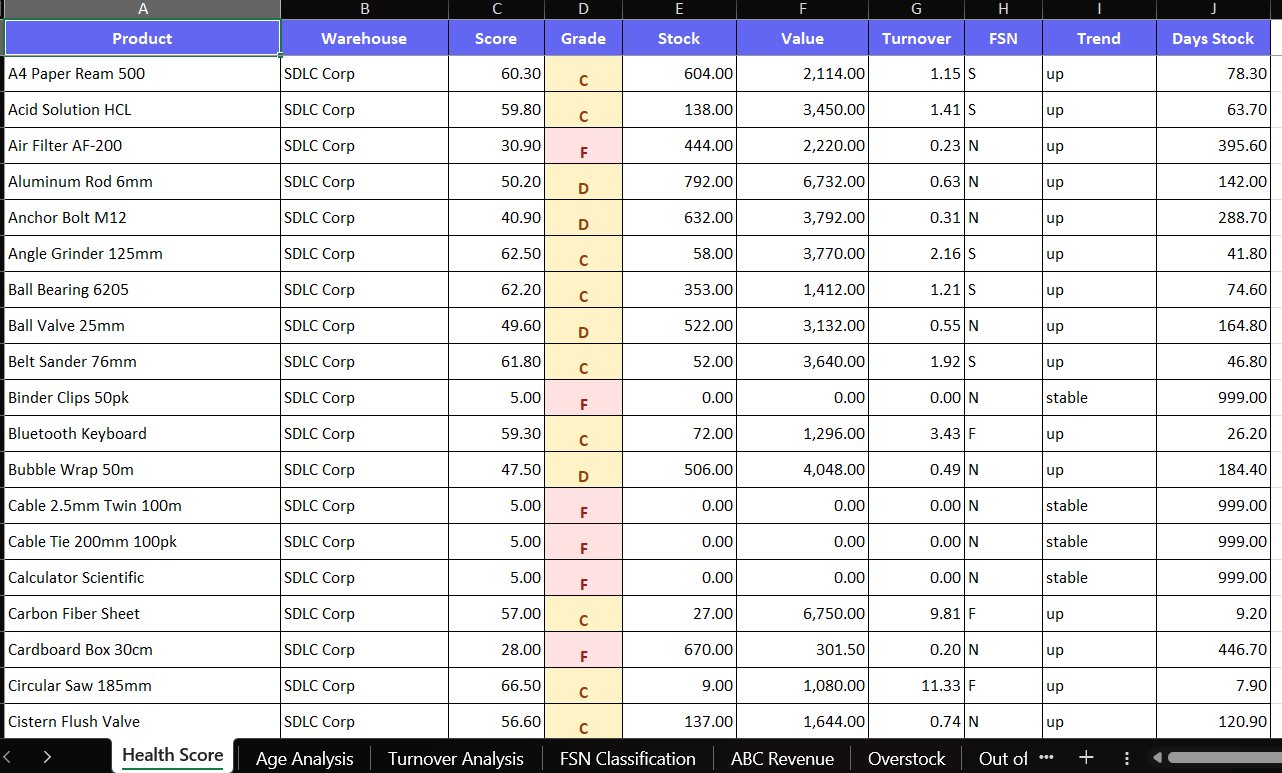
The Excel file includes:
- 8 sheets (one per report type)
- Formatted headers with indigo background
- Grade-colored cells (A/B = green, C/D = yellow, F = red)
- Sum footers on numeric columns
- Frozen header rows
Need Help?
Contact SDLC Corp at sdlccorp.com/contact-us or email sales@sdlccorp.com