Webhook Logs
Spotting an unhealthy webhook
A healthy webhook flow looks boring: events arrive, the connector acknowledges them, the queue stays empty. Use this page to spot the opposite:
- Recurring failures from the same event type — usually a Shopify-side rate limit or a duplicate registration.
- Webhooks that haven't arrived in hours — Shopify may have deactivated the endpoint after too many failures; re-register from Webhook Configuration.
- Slow processing latency — fine occasionally, concerning if persistent; check the queue.
Overview
This page is the operational dashboard for your Shopify webhooks. Once you've registered the webhooks in Webhook Configuration, use this view to:
- See every incoming event with its timestamp, type and processing status.
- Spot a sender that's failing repeatedly (often a Shopify-side rate limit or a duplicate registration).
- Inspect the full payload of any single delivery for debugging.
Monitor incoming webhook events from Shopify in real time.
Viewing Webhook Activity
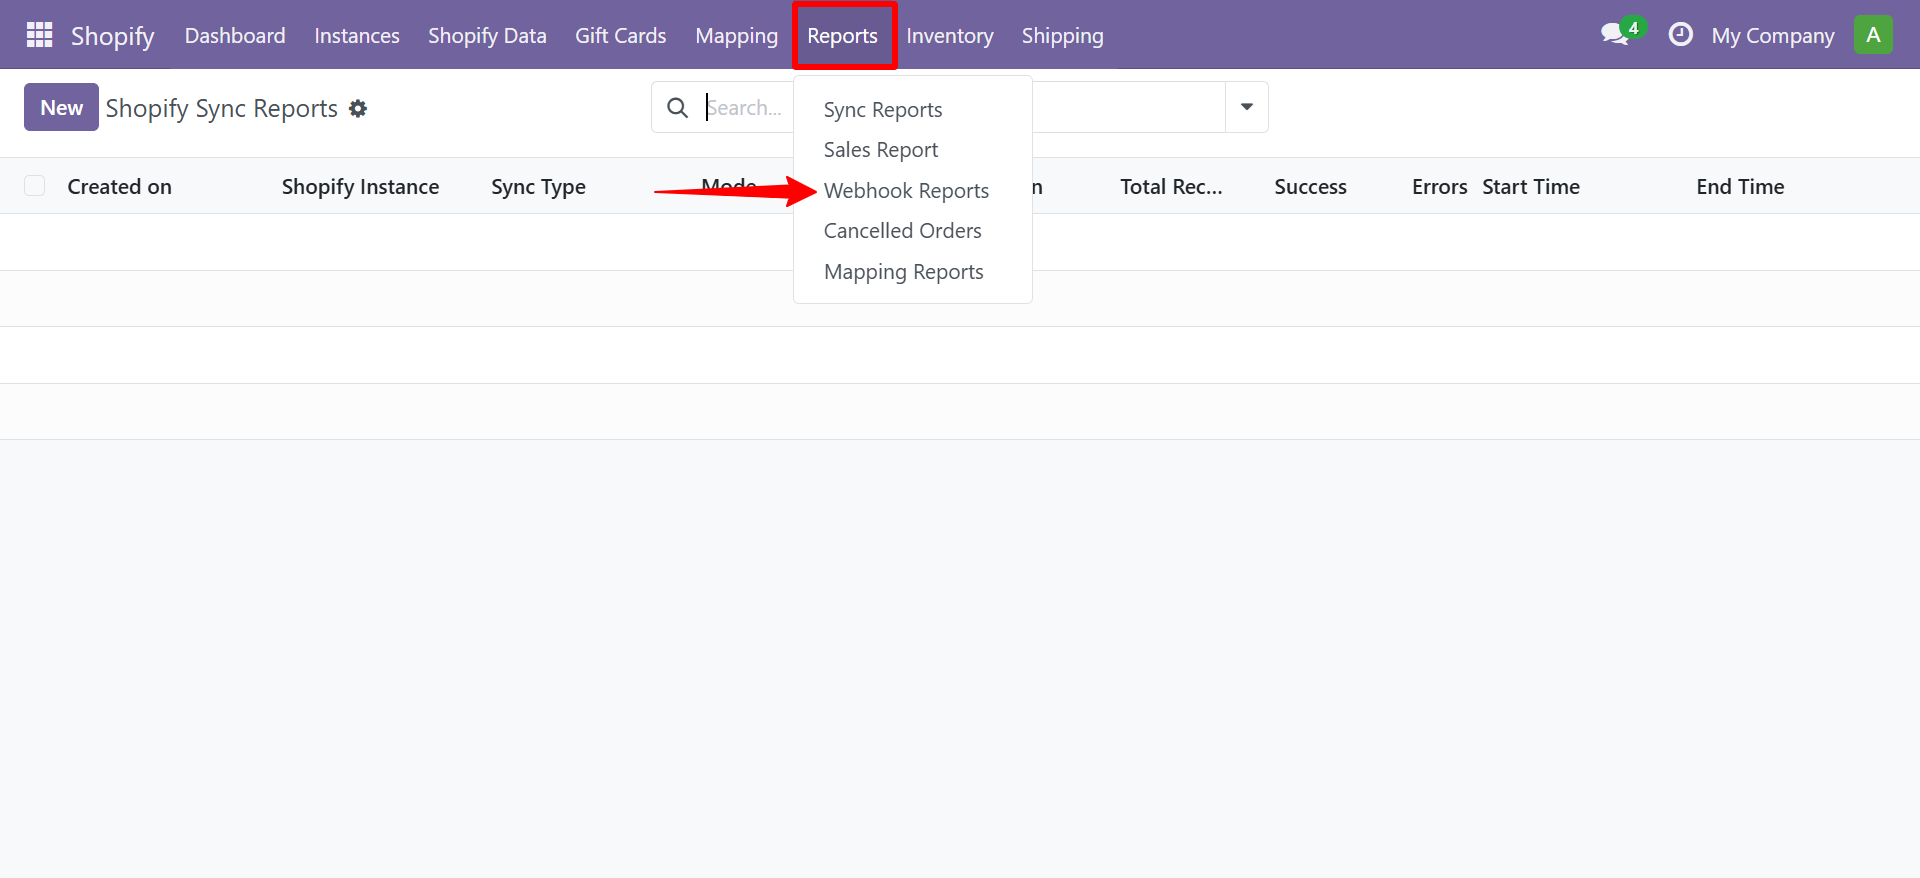
Navigate to Shopify → Reports → Webhook Reports
| Column | Description |
|---|---|
| Event | Webhook topic (e.g., orders/create) |
| Status | Received / Processed / Failed |
| Payload | Raw JSON payload from Shopify |
| Received At | Timestamp |
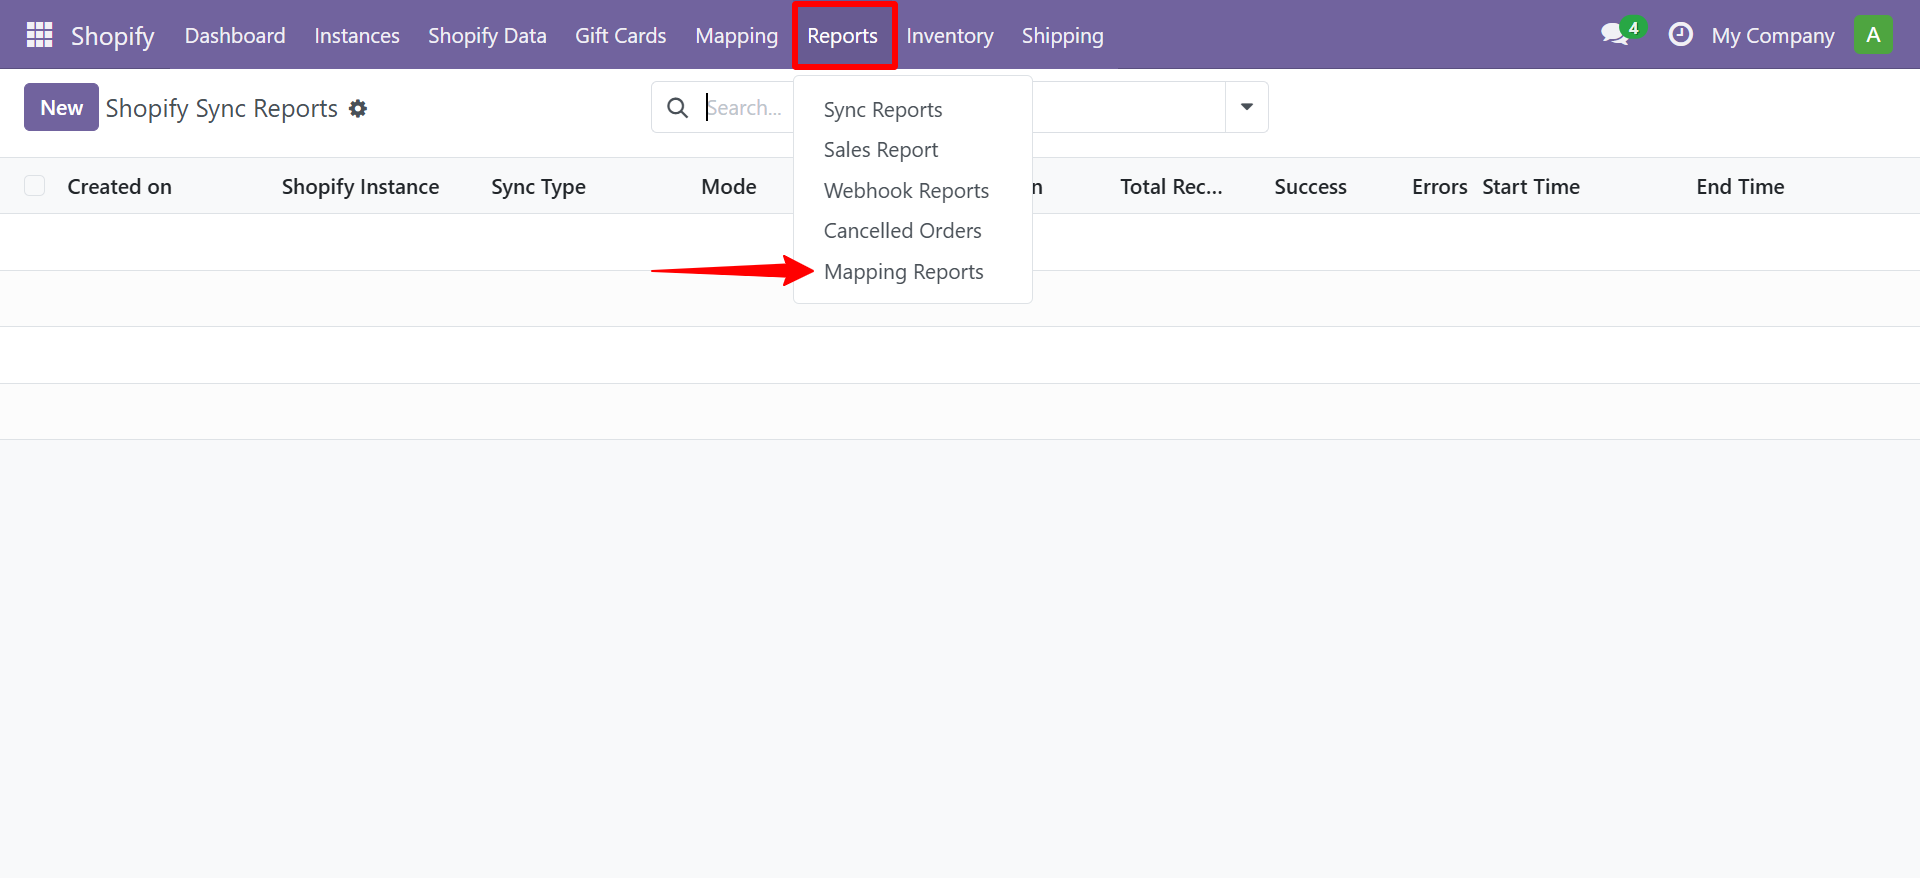
You can also view Mapping Reports from the Reports menu.
Need Help?
Contact SDLC Corp at sdlccorp.com/contact-us or email sales@sdlccorp.com