Project & Employee Dashboard Overview
The Project Analytics Dashboard provides a comprehensive, real-time view of project progress, team workload, and productivity metrics. This page walks through every section of the dashboard from top to bottom.
Accessing the Dashboard
Navigate to Project > Dashboard from the Odoo main menu. The dashboard auto-refreshes every 60 seconds. A green Live badge in the header indicates active monitoring.
Stat Cards
Six animated stat cards span the top of the dashboard, giving you an at-a-glance summary of your entire project portfolio.
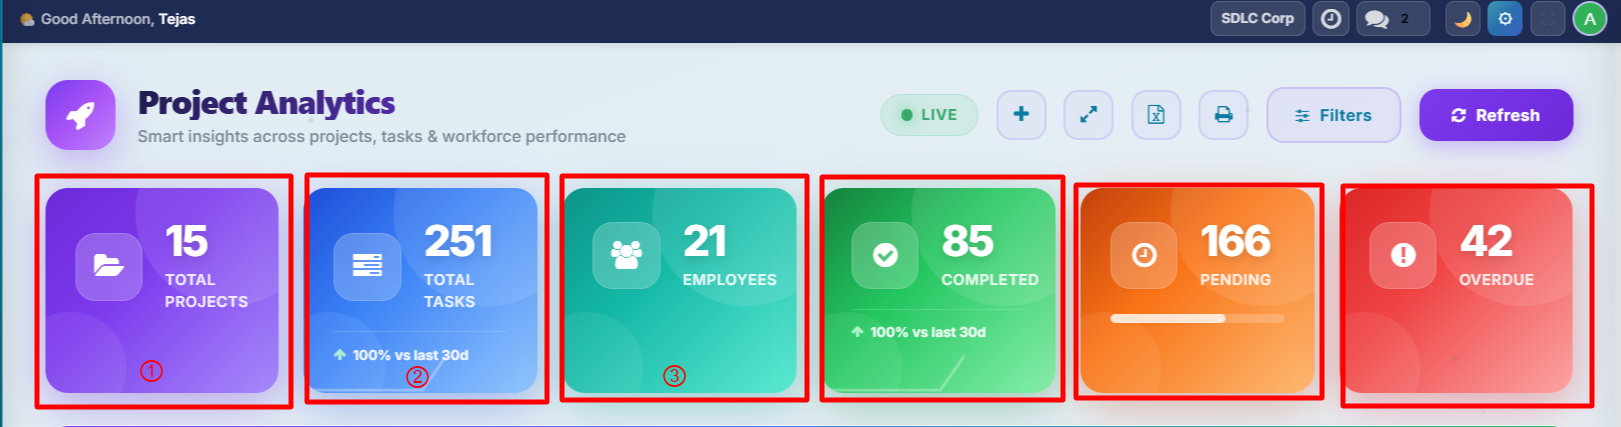
| Card | Colour | Description |
|---|---|---|
| Total Projects | Purple | Count of active projects. Click to open the project list. |
| Total Tasks | Blue | All tasks with a 30-day trend arrow and sparkline chart. |
| Total Employees | Teal | HR headcount. Click to open the employee list. |
| Completed Tasks | Green | Tasks marked as done. |
| Pending Tasks | Orange | Tasks still in progress. |
| Overdue Tasks | Red | Tasks past their deadline. Click to view overdue tasks. |
Each card includes a trend comparison (e.g., "Up 15% vs last 30 days") and mini sparkline charts showing Created, Completed, and Overdue trends over the past 7 days.
Smart Insights
Below the stat cards, up to 5 rule-based text insights provide actionable recommendations based on your current data.
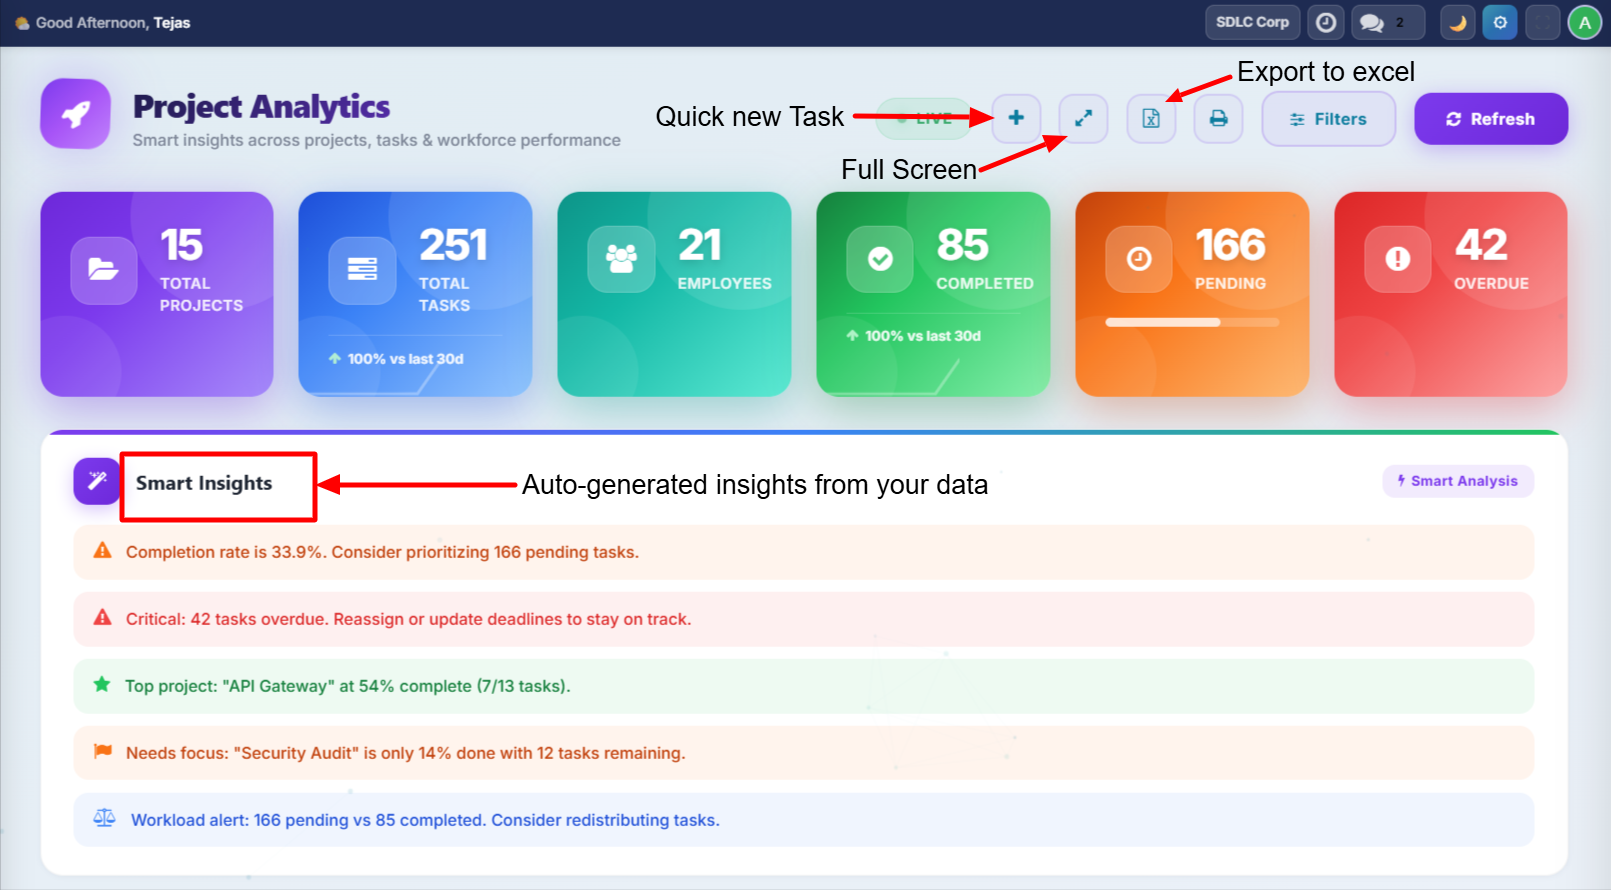
| Insight Type | Example |
|---|---|
| Performance | "Excellent! 85% completion rate -- your team is performing above targets." |
| Overdue Alert | "Critical: 8 tasks are overdue. Immediate attention required." |
| Best Project | "Website Redesign leads with 92% completion." |
| Worst Project | "Cloud Migration is at 23% -- needs intervention." |
| Workload | "Pending tasks exceed completed -- consider redistributing work." |
Insights are rule-based, not AI/ML. They evaluate completion rates, overdue counts, project progress, and workload balance to generate recommendations.
All Tasks Card
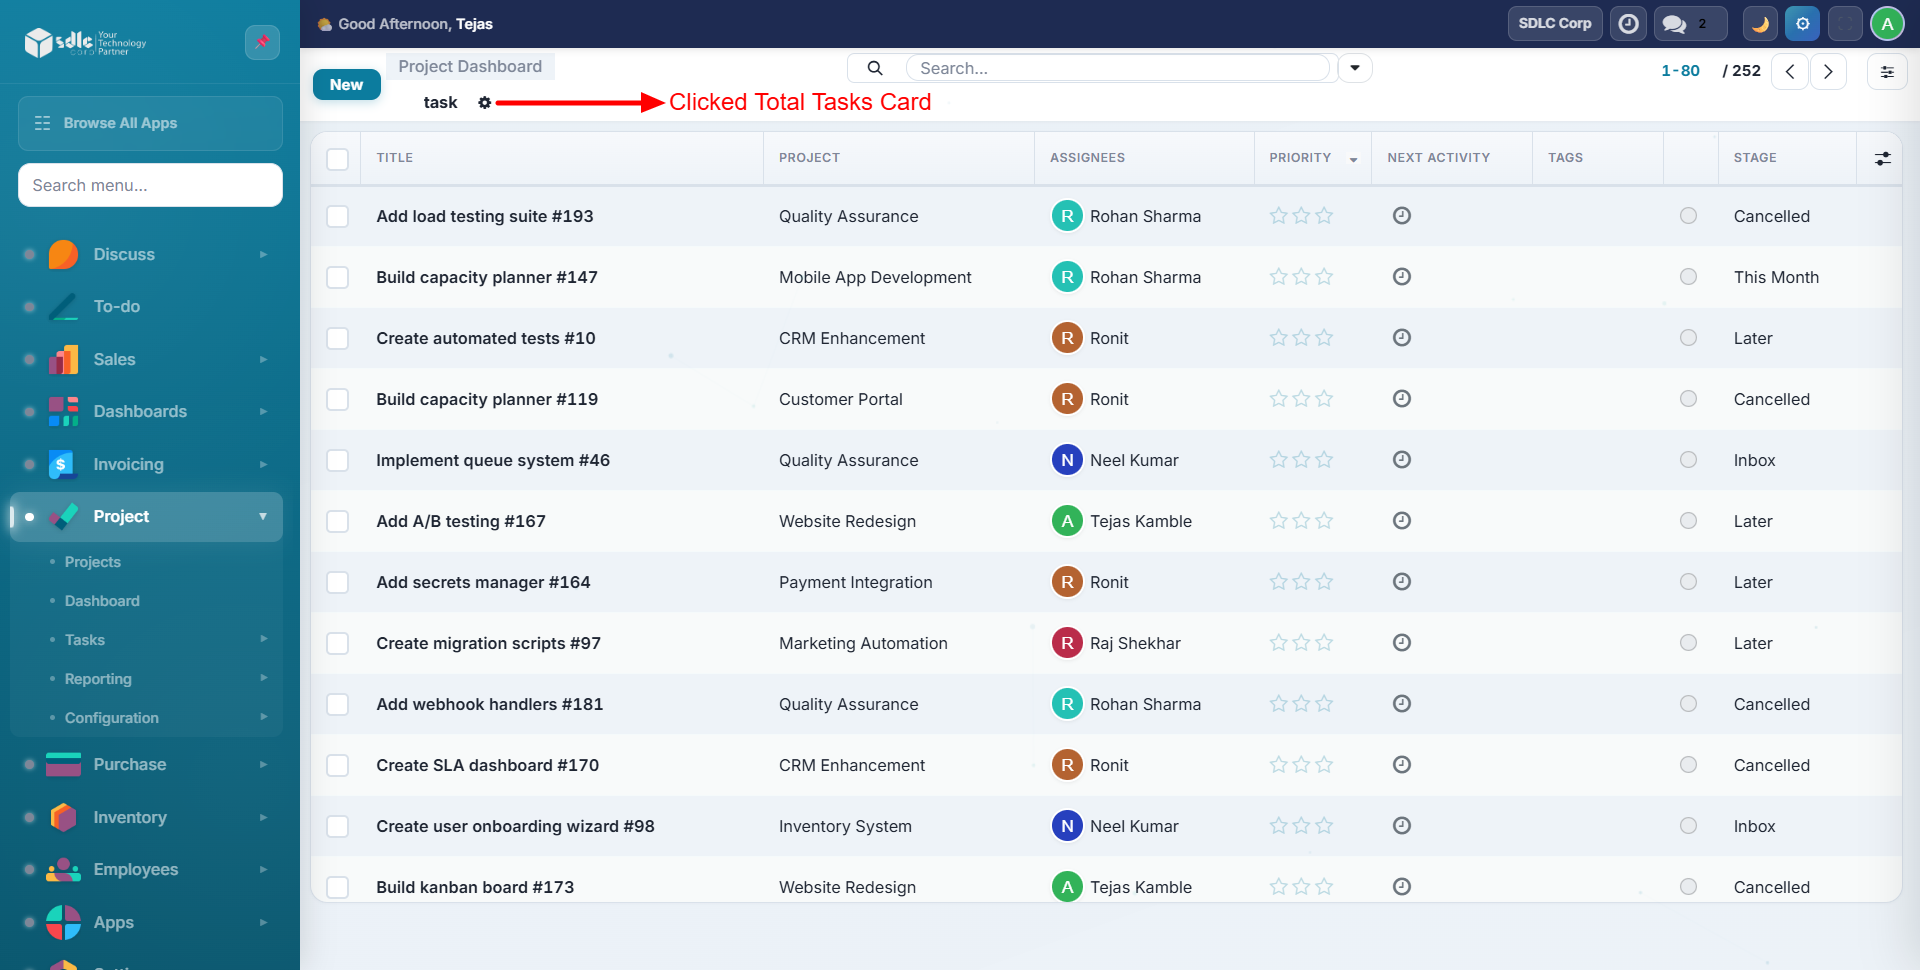
The All Tasks card provides a consolidated view of every task across your projects, with counts and status breakdowns.
Total Employee List
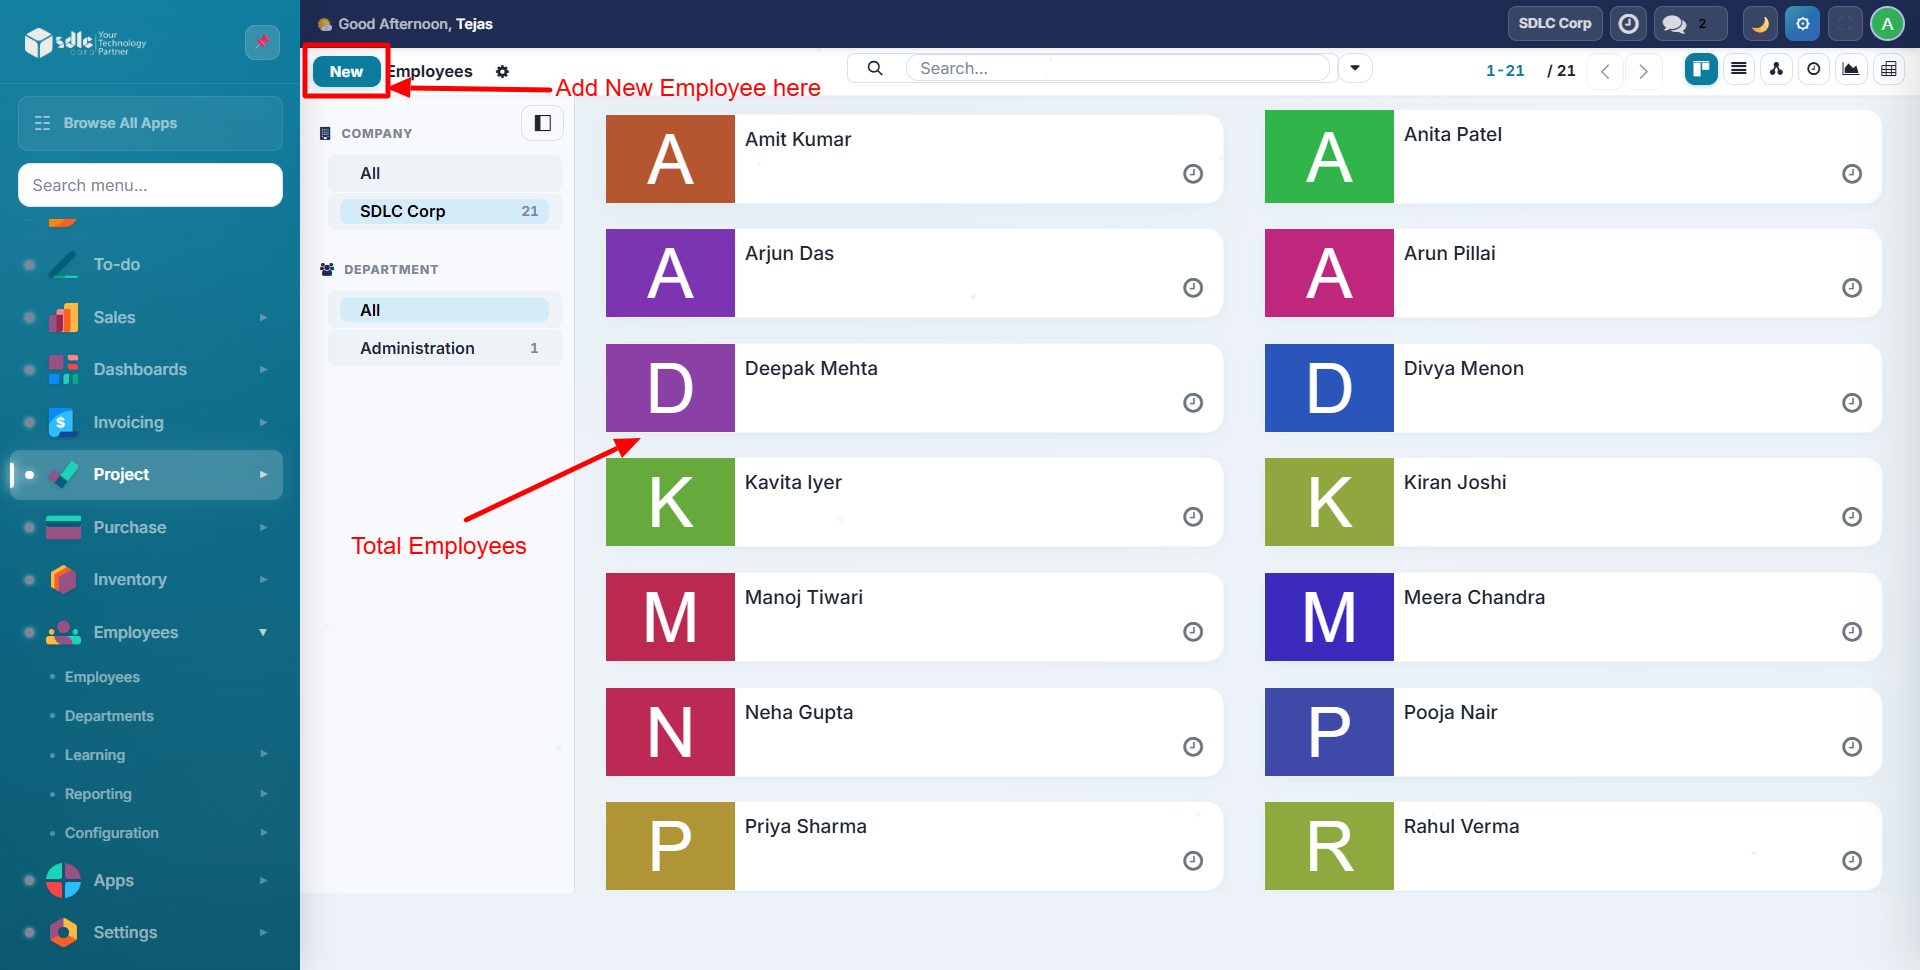
View a summary of all employees involved in projects, with department distribution and headcount details.
Department Distribution, Task Breakdown, and Charts
This section presents a department-level pie chart alongside task distribution charts, giving you visibility into how work is spread across your organization.
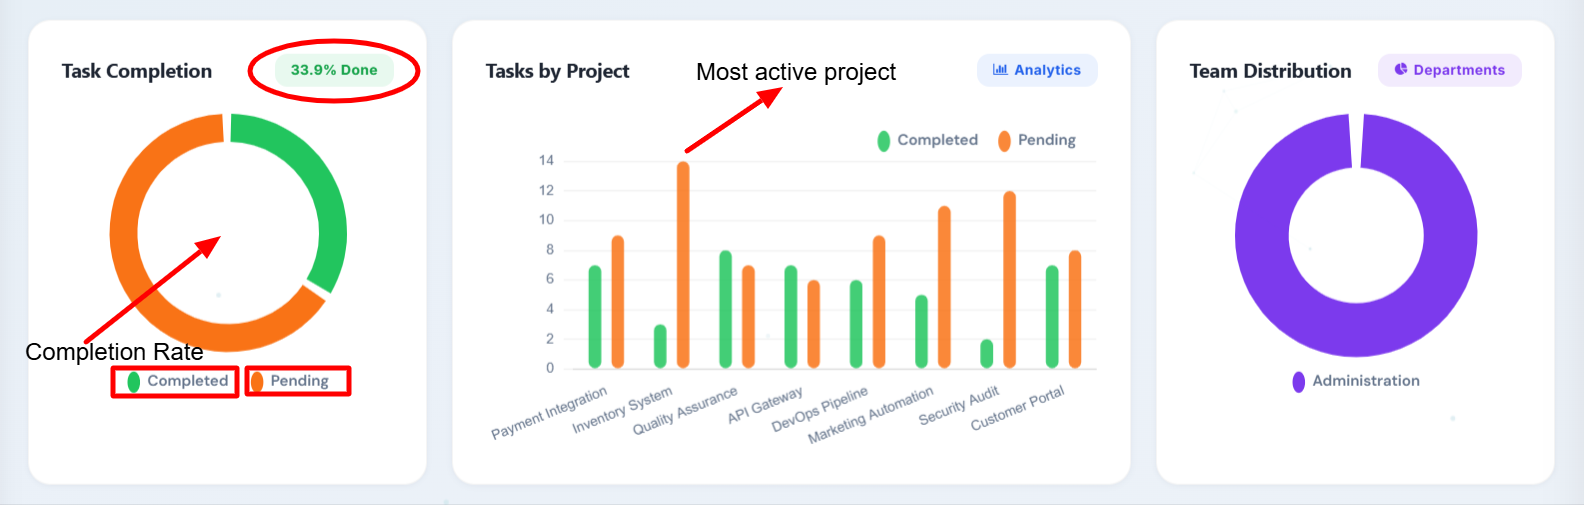
The Department Pie Chart shows employees grouped by department, helping you visualize team composition and identify where resources are concentrated.
Team Workload
The team workload chart displays the top 10 team members ranked by task count using horizontal bars.
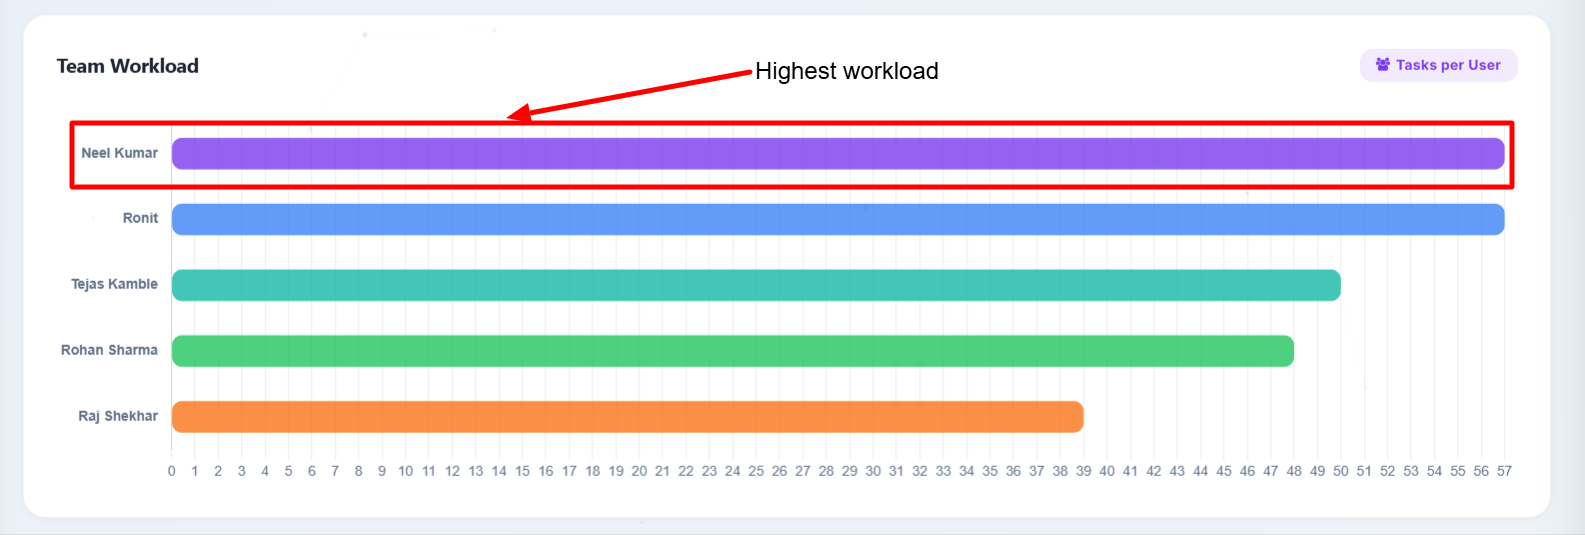
Use this chart to identify overloaded or underutilized staff members and redistribute work accordingly.
Weekly Trend (Velocity Chart)
The velocity chart tracks tasks created versus tasks completed on a week-by-week basis, with a net line showing the difference.
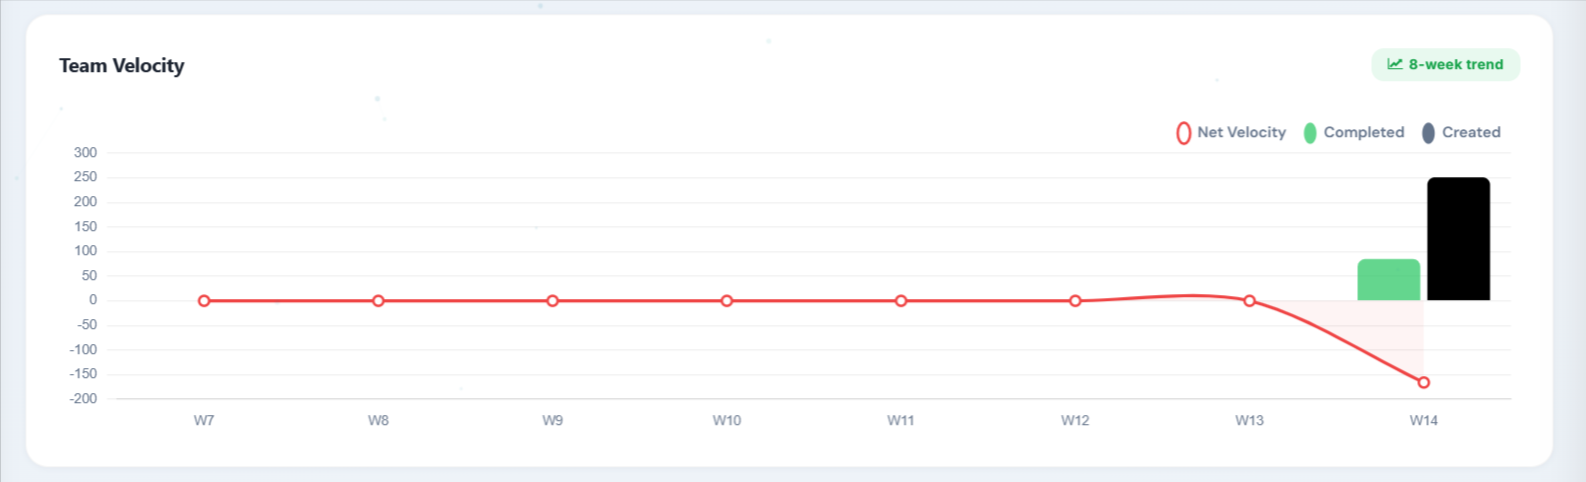
This 8-week trend helps you spot capacity issues early. When the "created" line consistently exceeds the "completed" line, your team may be taking on more work than it can handle.
Workload Heatmap
The workload heatmap provides a visual grid of task distribution across team members and time periods.
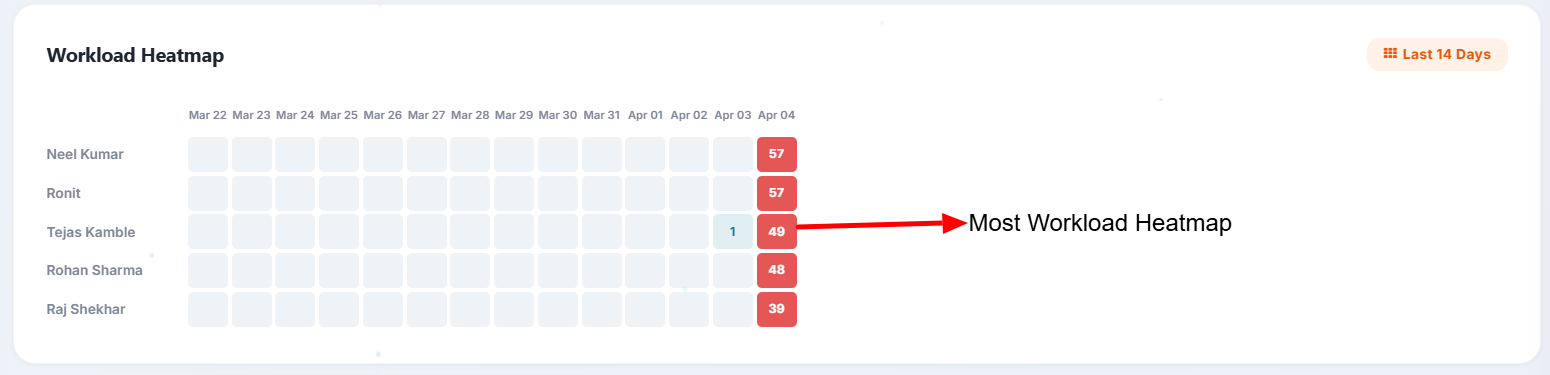
Darker cells indicate higher concentrations of work. Use this to identify bottlenecks and ensure even workload distribution across the team.
Stage-Wise Projects
Badges display project counts grouped by stage -- On Track, At Risk, Off Track, Done, and any custom stages configured in your Odoo instance.

This section adapts automatically to your Odoo project stage configuration, so custom stages appear without any additional setup.
Project Progress Bars
Colour-coded progress bars show completion percentage for each project at a glance.
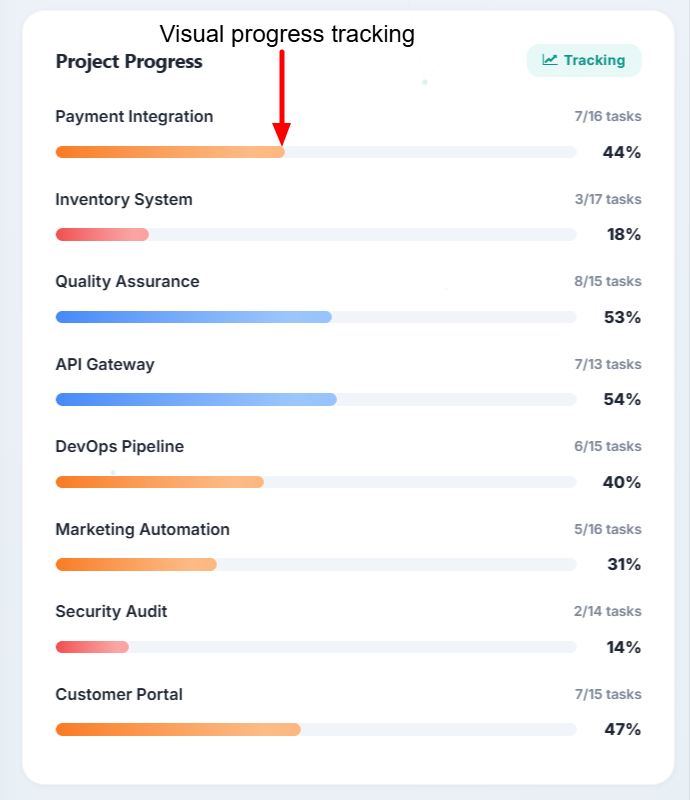
| Colour | Completion |
|---|---|
| Green | Above 75% |
| Blue | 50--75% |
| Orange | 25--50% |
| Red | Below 25% |
Recent Tasks
A table of the 8 most recent tasks provides quick access to current work items.
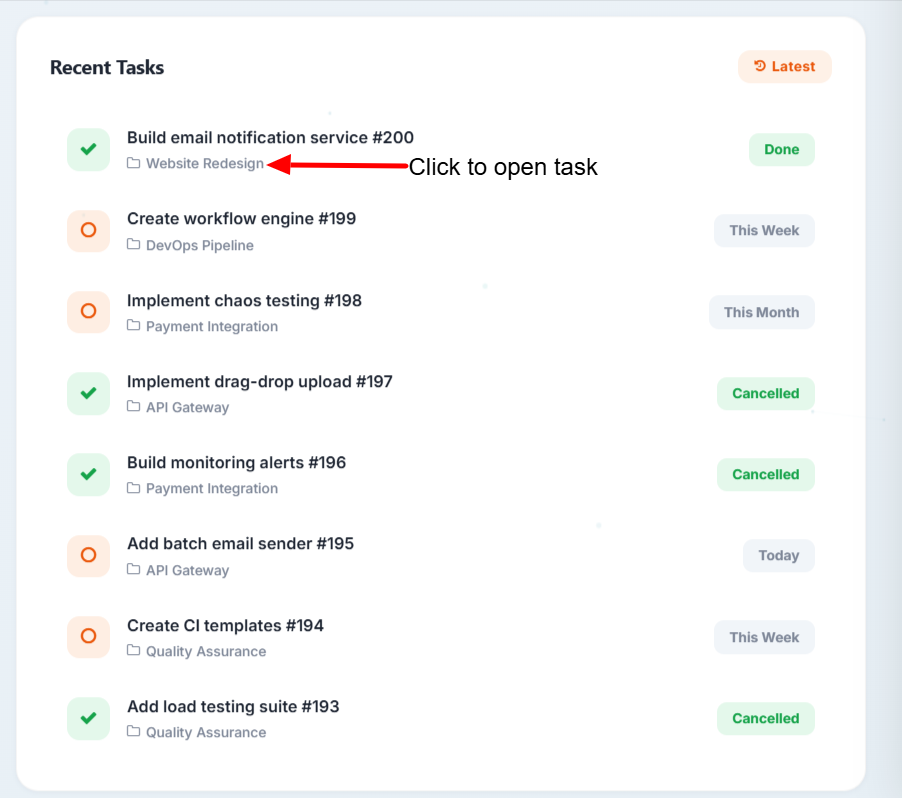
Each row displays:
- Task Name -- click to open the task form
- Project -- parent project
- Stage -- current kanban stage
- Status -- Done or In Progress
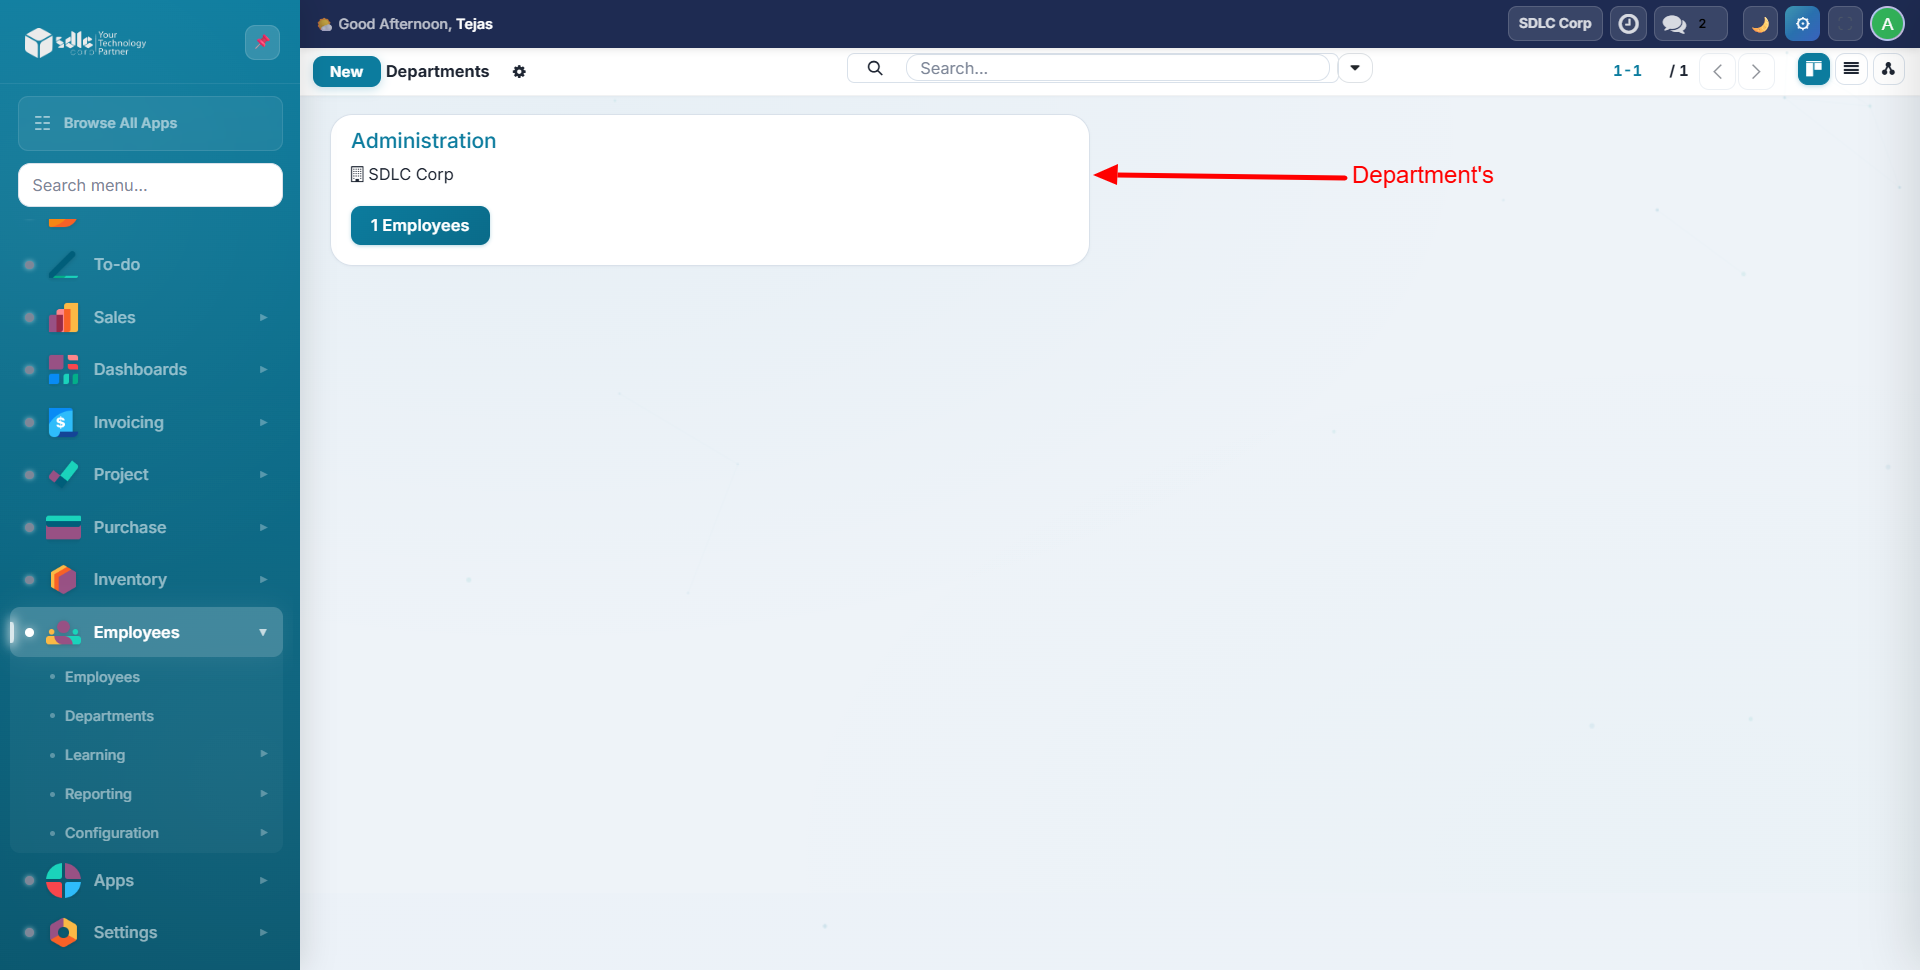
Departments
The departments section provides a detailed breakdown of employees and tasks organized by department.
Celebration Confetti
When your team reaches 100% completion on all tasks, a 50-particle confetti animation fires automatically to celebrate the milestone.
Need Help?
Contact SDLC Corp at sdlccorp.com/contact-us