Dark Mode
The Project Analytics Dashboard includes full dark mode support, ensuring a comfortable viewing experience regardless of your Odoo theme preference.
How It Works
The dashboard automatically detects your Odoo theme setting (light or dark) and adjusts the entire interface accordingly. There is no separate toggle within the dashboard -- it follows your Odoo-wide theme preference.
To switch between light and dark mode:
- Go to Settings in Odoo.
- Change the Theme preference to dark or light mode.
- The dashboard adapts instantly on your next visit.
Dark Mode Appearance
In dark mode, all chart colours, card backgrounds, text, borders, and grid lines are adjusted for optimal readability on dark backgrounds.
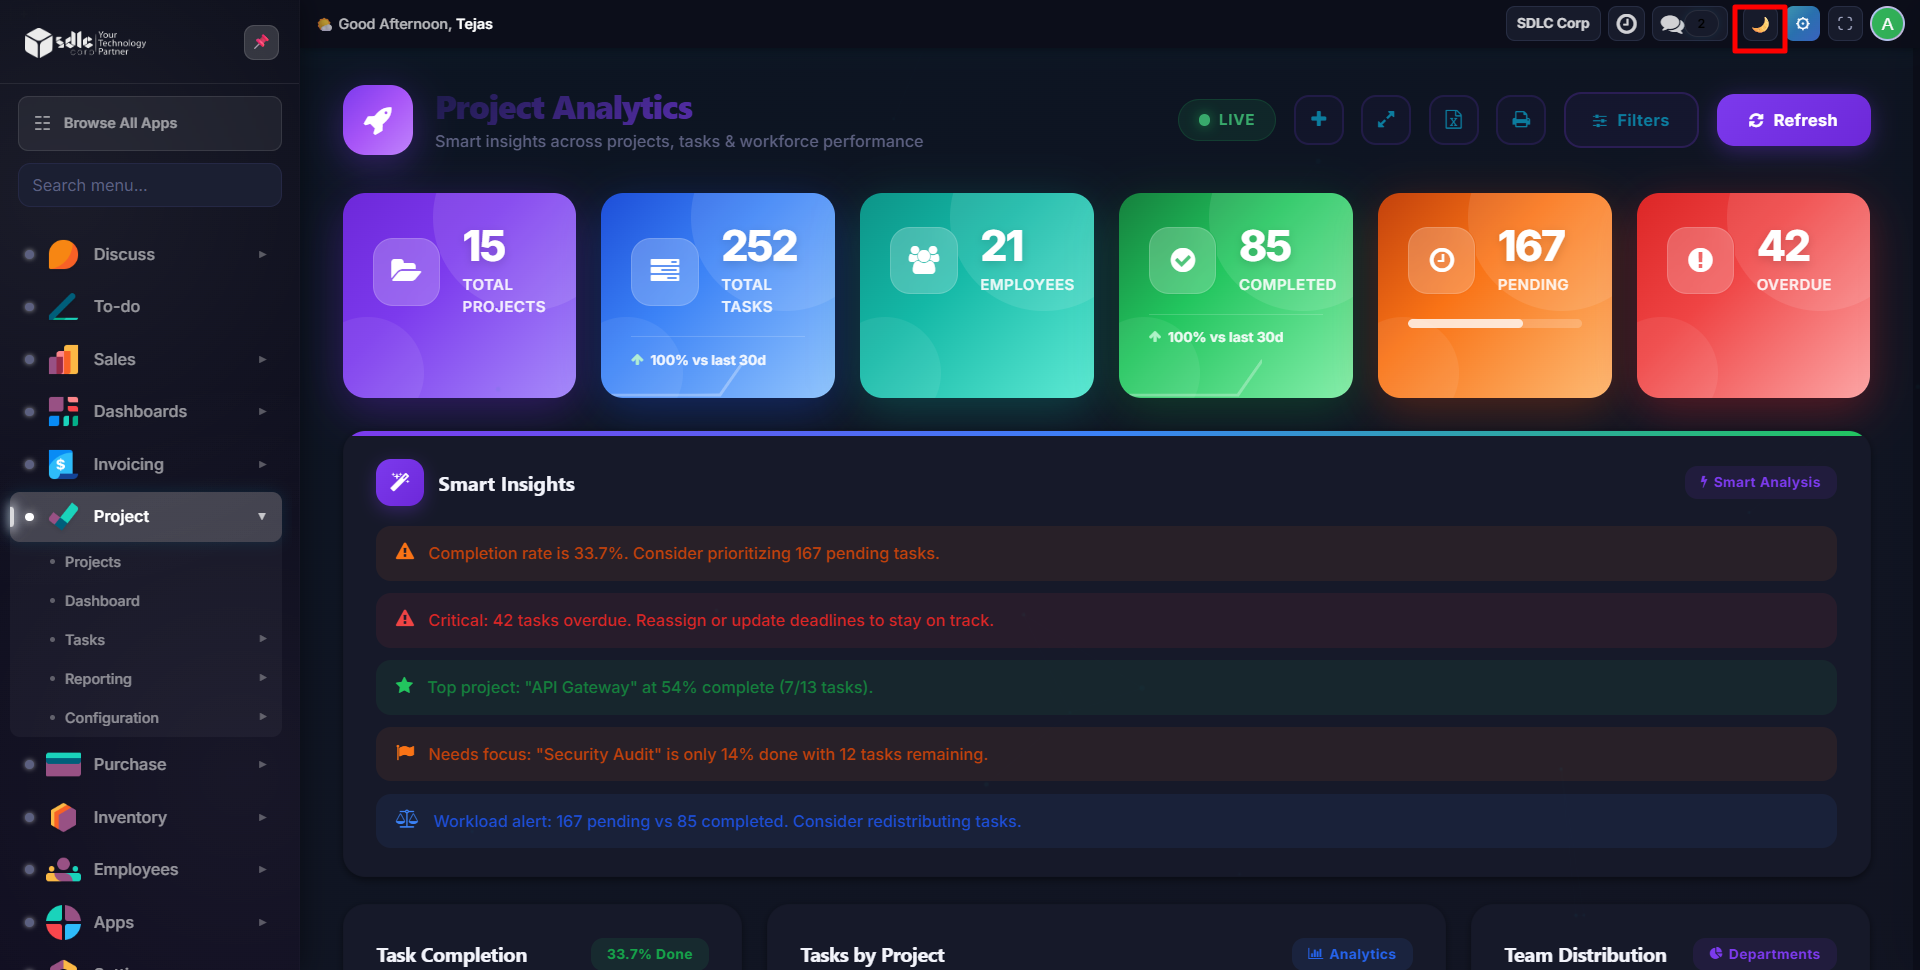
Key adaptations in dark mode:
- Stat card backgrounds use darker tones with lighter text
- Chart axes, labels, and gridlines use light colours for contrast
- Smart insight cards adapt their background and text colours
- Filter bar and modals follow the dark theme
- Progress bars and badges maintain visibility with adjusted palettes
Light Mode
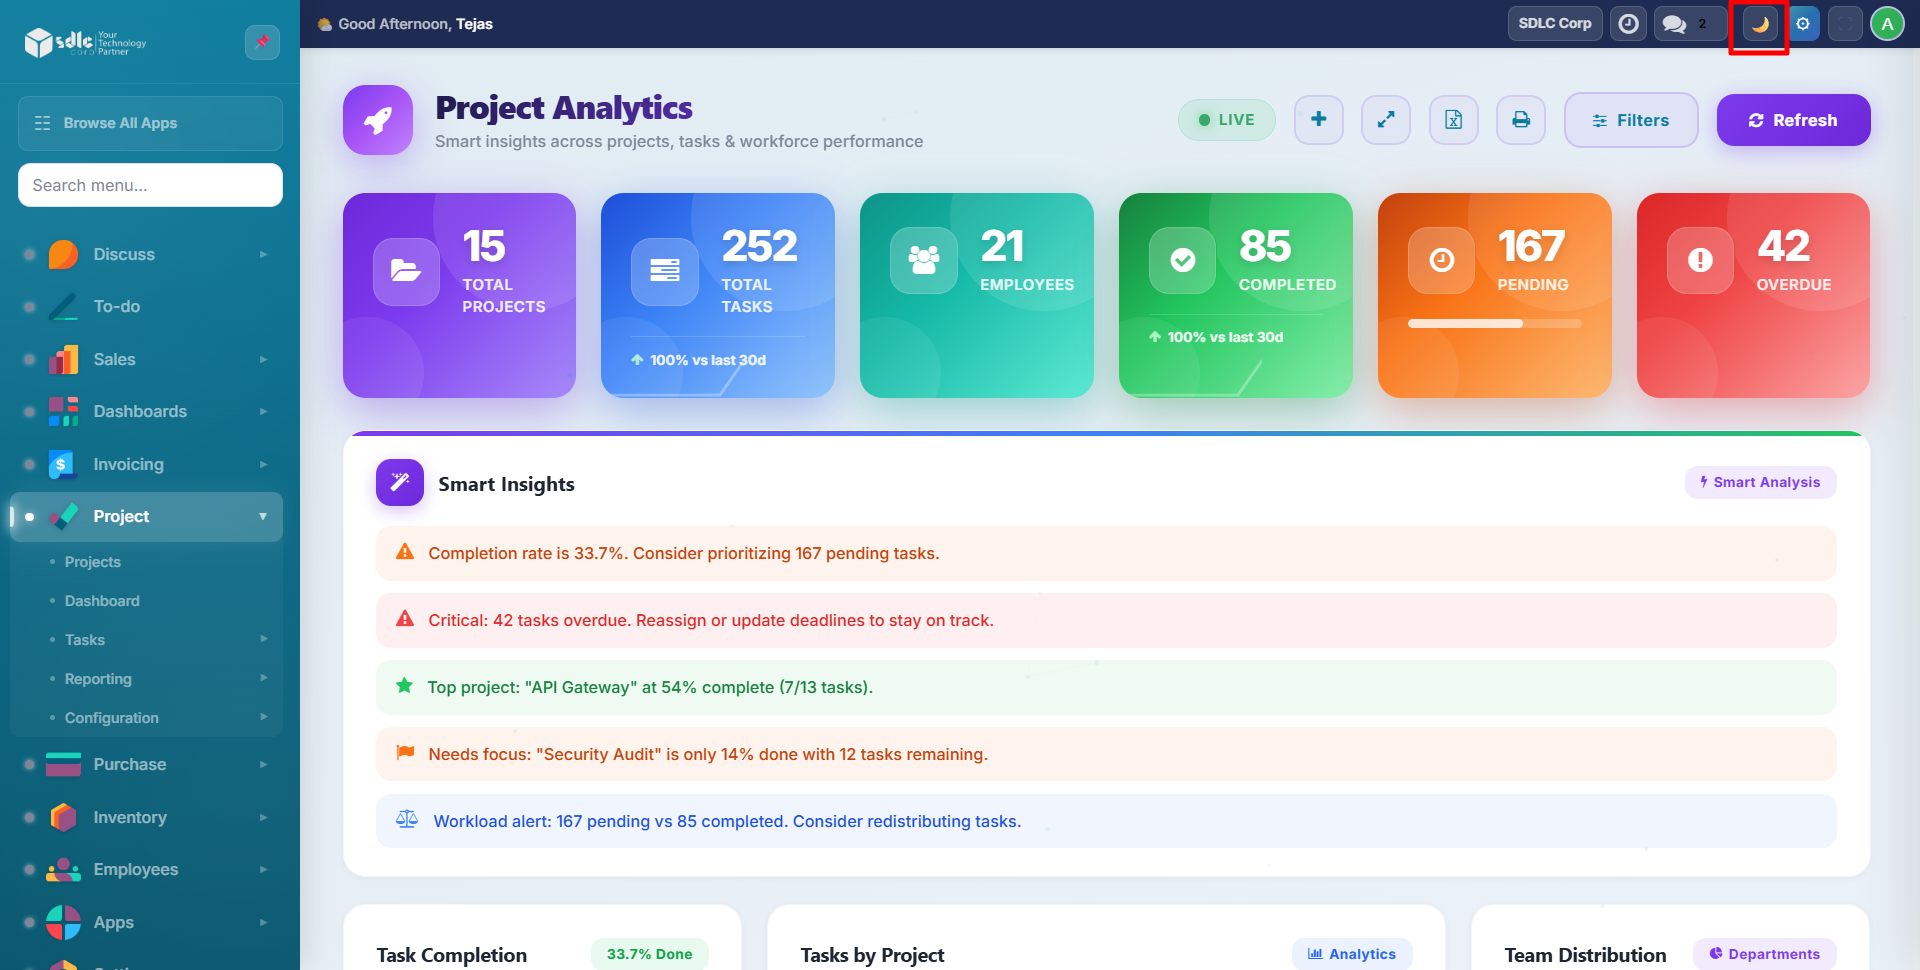
The default light mode provides a clean, professional appearance with standard colour contrasts.
Charts and Graphs
All Chart.js-powered visualizations (pie charts, bar charts, velocity trends, heatmap) dynamically adjust their:
- Background colours
- Border colours
- Axis label colours
- Grid line colours
- Tooltip styling
This ensures every chart remains readable in both modes without manual intervention.
Dark mode support extends to the Excel export as well -- the exported file uses a consistent colour scheme regardless of your current theme.
Need Help?
Contact SDLC Corp at sdlccorp.com/contact-us