Project Analytics Dashboard
Welcome to the official documentation for the SDLC Corp Project Analytics Dashboard, a real-time project analytics dashboard for Odoo 19 with smart insights, interactive charts, team workload tracking, dark mode, and Excel export.
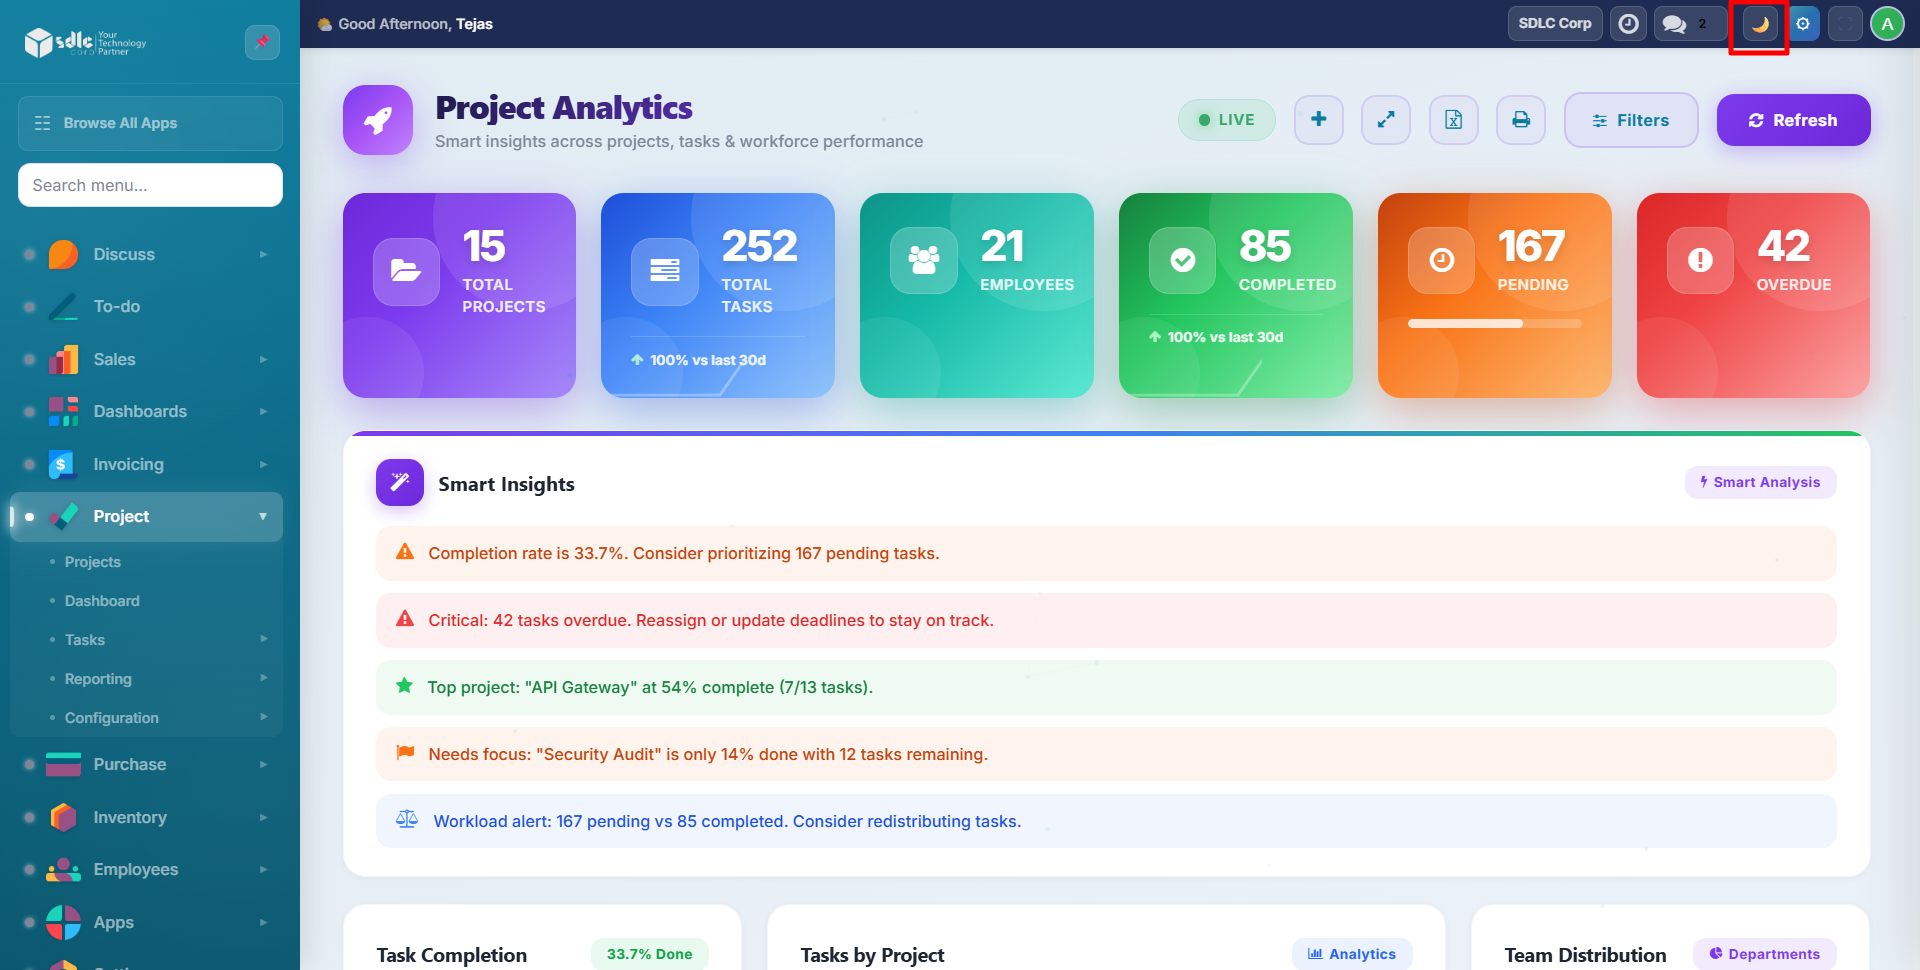
Key Capabilities
| Category | What's Included |
|---|---|
| Analytics | 6 stat cards, completion rates, productivity score, trend comparison |
| Smart Insights | Rule-based text insights with performance assessments and alerts |
| Charts | Department pie, team workload bars, weekly velocity, workload heatmap |
| Project Tracking | Stage-wise project view, progress bars, recent tasks table |
| Quick Actions | Quick task create, one-click navigation, fullscreen mode |
| Filters | Filter by project, department, and date range with instant updates |
| Export | Excel download with 4 styled worksheets |
| Dark Mode | Automatic light/dark theme detection with full chart adaptation |
| Keyboard Shortcuts | R (refresh), F (fullscreen), N (new task) |
| Auto-Refresh | Live data every 60 seconds |
Supported Versions
- Odoo: v19
Quick Start
- Install the module
- Explore the dashboard
- Use filters, quick task, and navigation
- Export to Excel
- Toggle dark mode
Need Help?
Where to go next
- Getting Started - install the module and access the dashboard.
- Dashboard Overview - tour every widget on the page.
- Actions & Filters - quick task creation, filtering and keyboard shortcuts.
- Excel Export - export to a 4-worksheet workbook with styling.
- FAQ - common questions about refresh frequency, Excel export, dark mode and the Productivity Score.