Reports & Analysis
The Project Costing module includes an interactive Project Financial Dashboard that provides a comprehensive, real-time view of your project finances with KPI cards, bar charts, alert tables, breakdown panels, and a detailed budget table.
Accessing the Dashboard
Navigate to Project > Dashboard from the main Odoo menu. The dashboard loads automatically with data from all your projects.
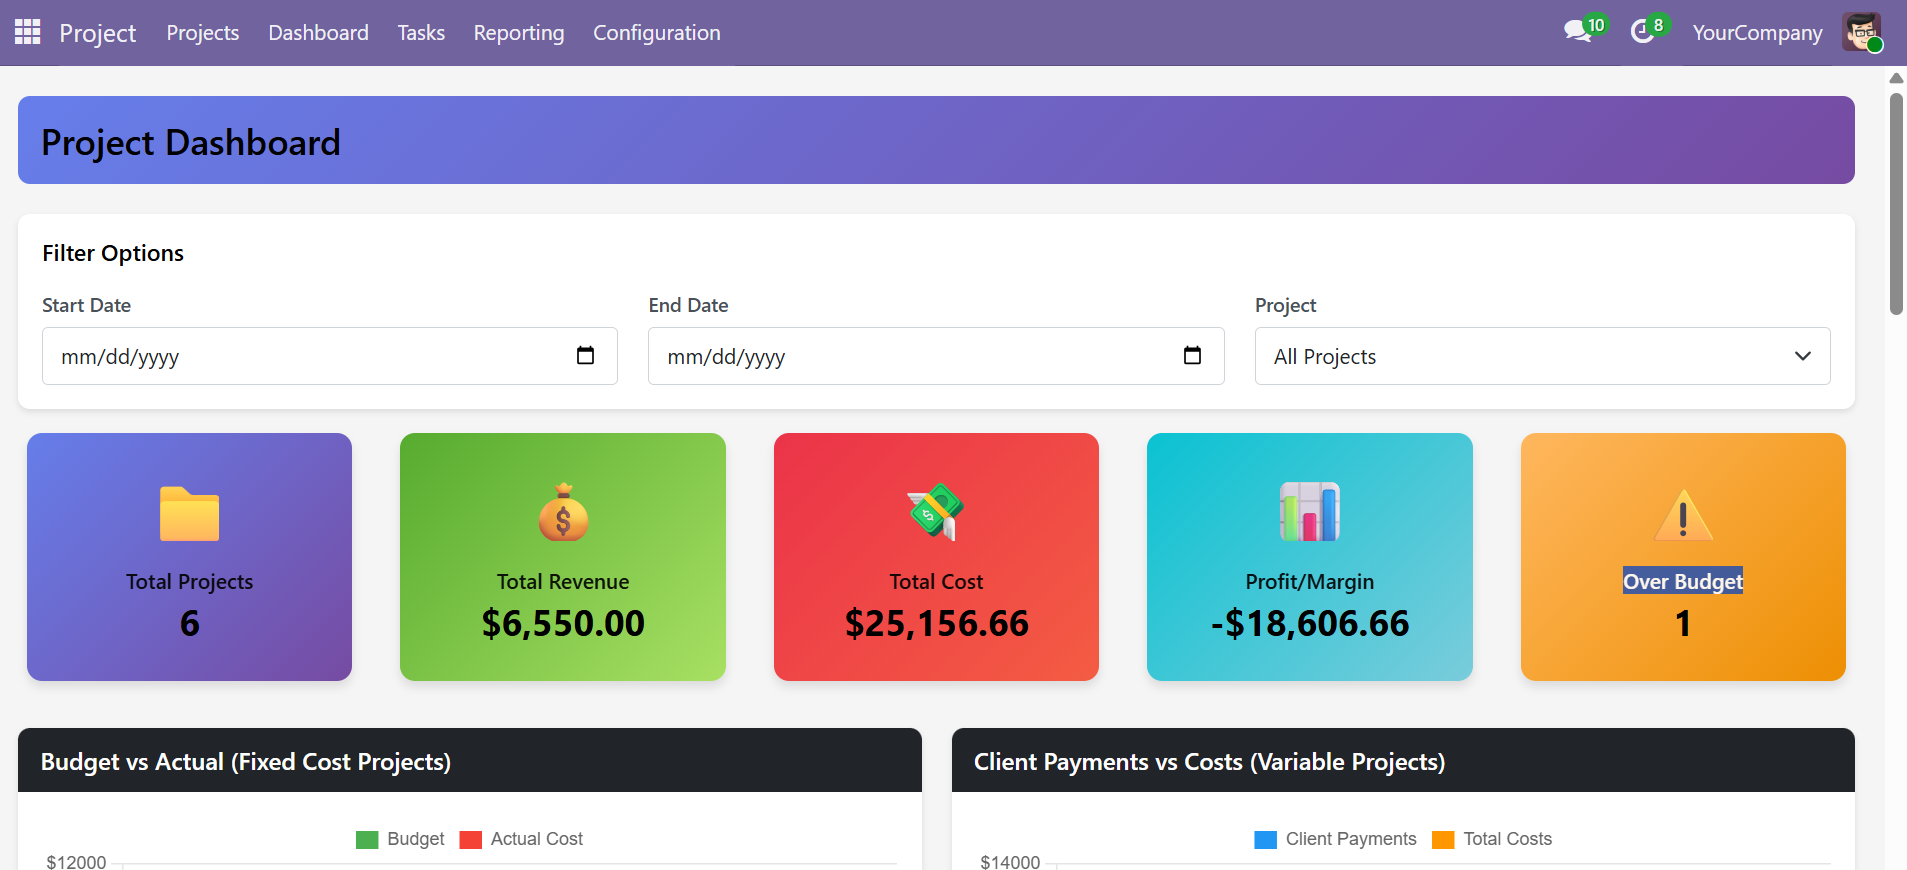 Project Dashboard with KPI cards: Total Projects, Revenue, Cost, Profit/Margin, and Over Budget count
Dashboard Layout
The dashboard is organized into the following sections from top to bottom:
| Section | Description |
|---|---|
| Filters | Date range (Start/End) and project selector to narrow down data |
| KPI Summary Cards | Five color-coded cards showing Total Projects, Revenue, Cost, Profit/Margin, Over Budget count |
| Budget vs Actual Chart | Bar chart comparing budgets to actual costs for Fixed Cost projects |
| Client Payments vs Costs Chart | Bar chart for Variable Cost projects showing payments received vs costs incurred |
| Cost Analysis Chart | Stacked bar chart showing Labor Cost vs Extra Costs per project |
| Over Budget Alerts | Table listing projects that exceed their budget with variance details |
| Cost Breakdown | Panel showing Labor Cost, Extra Costs, and Total Cost |
| Revenue Breakdown | Panel showing Fixed Budgets, Client Payments, and Total Revenue |
| Budget Details Table | Complete project-wise table with Type, Budget, Costs, Profit, Margin %, Hours, Status, and Utilization |
Using Filters
The filter section at the top of the dashboard allows you to narrow your view:
- Start Date -- Filter data from this date onward
- End Date -- Filter data up to this date
- Project -- Select a specific project to view its individual financial data
Leave all filters empty to see an aggregated view across all projects. The dashboard updates in real-time as you change filter values.
KPI Summary Cards
The dashboard displays five color-coded KPI cards at the top, providing a quick snapshot of your project finances.
| Card | Color | What It Shows | How It's Calculated |
|---|---|---|---|
| Total Projects | Purple | Count of projects matching current filters | Count of all active projects |
| Total Revenue | Green | Sum of all project revenues | Fixed Cost budgets + Variable Cost client payments |
| Total Cost | Red | Sum of all project costs | Labor costs (timesheets) + Extra costs |
| Profit / Margin | Cyan | Overall profit and margin percentage | (Revenue - Cost) / Revenue x 100 |
| Over Budget | Orange | Number of projects exceeding their budget | Count where Total Cost > Project Budget |
Budget vs Actual (Fixed Cost Projects)
This bar chart compares the approved budget against actual costs for all Fixed Cost projects. It helps identify which projects are on track and which are over budget at a glance.
- Green bars: Approved project budget
- Red bars: Actual costs incurred (Labor + Extra Costs)
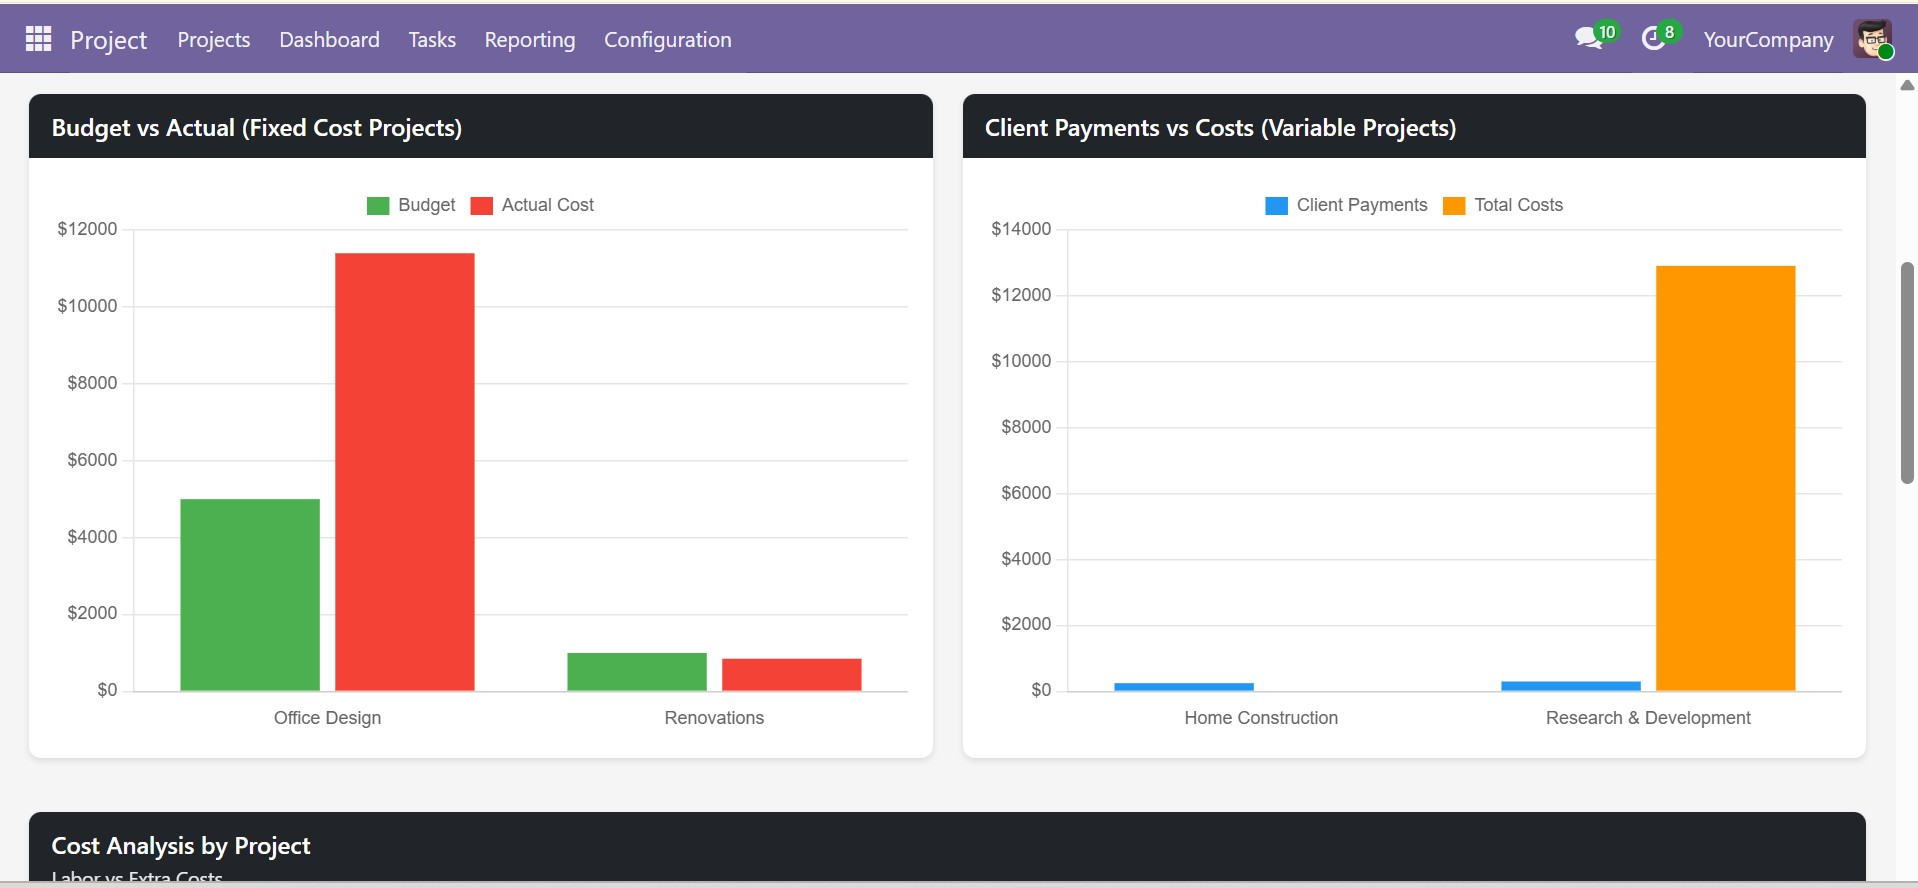 Budget vs Actual (Fixed Cost) and Client Payments vs Costs (Variable Cost) bar charts side by side
Client Payments vs Costs (Variable Cost Projects)
This chart compares client payments received against costs incurred for Variable Cost projects. Useful for tracking whether client payments are covering ongoing project expenses.
- Blue bars: Total client payments received
- Orange bars: Total costs incurred
Cost Analysis by Project
A stacked bar chart showing the composition of costs for each project, breaking down into:
- Purple bars: Labor Cost (total timesheet-based employee costs)
- Red bars: Extra Costs (total miscellaneous expenses logged)
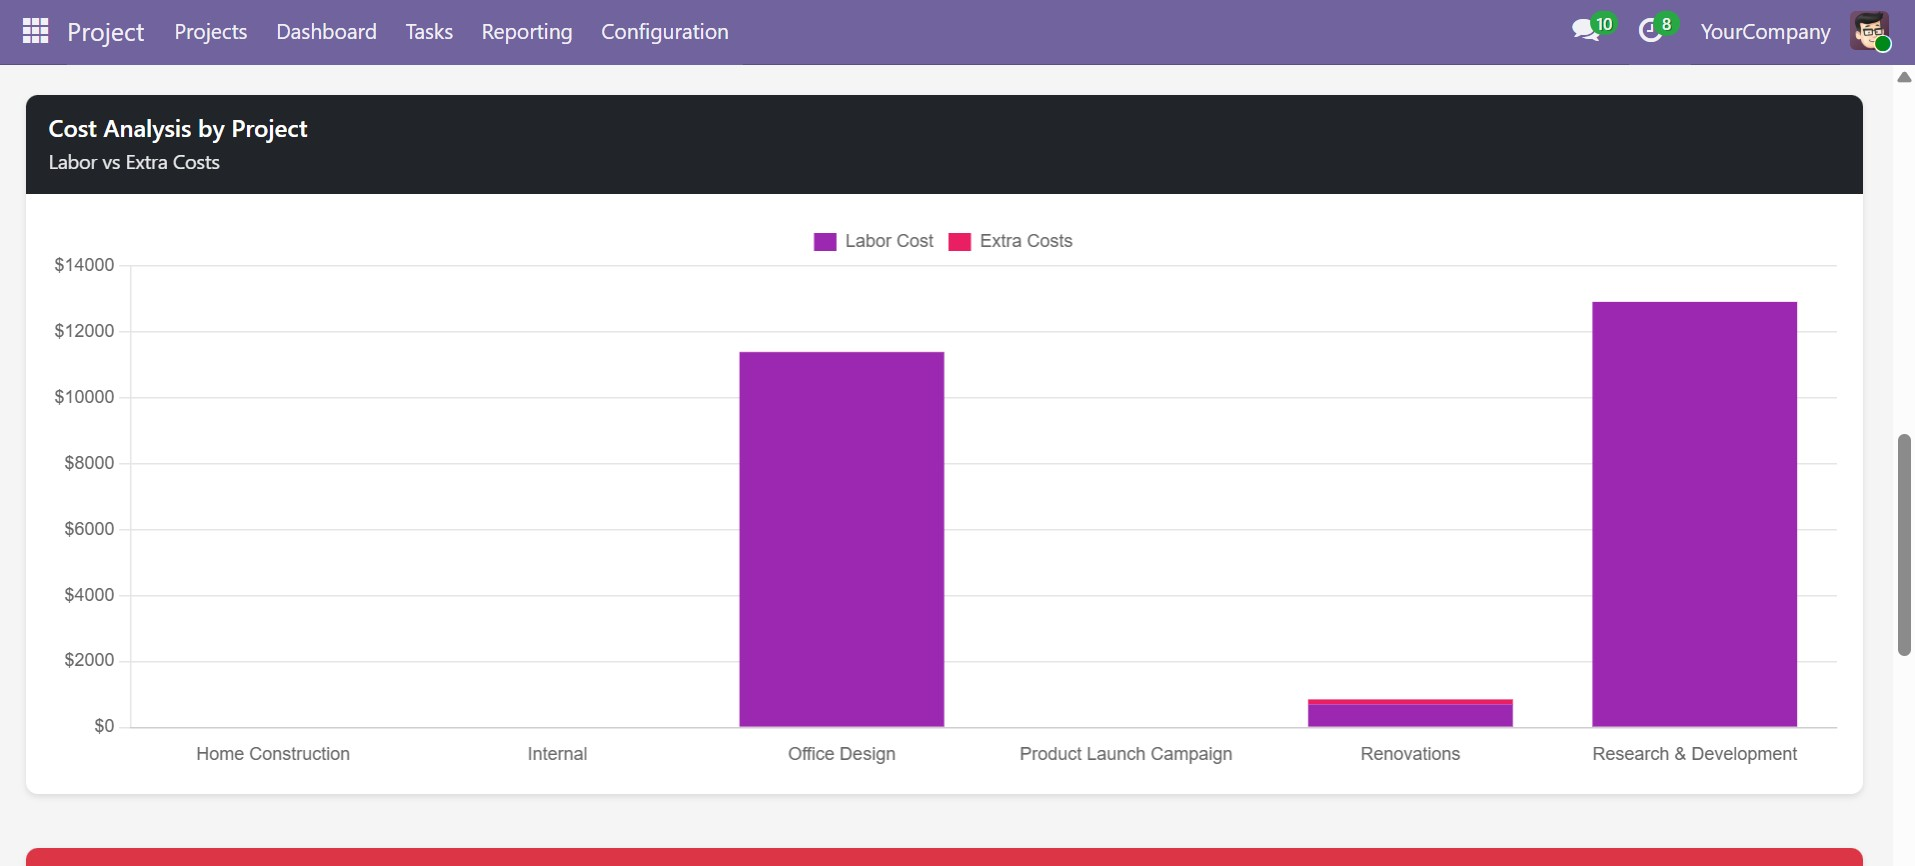 Cost Analysis by Project -- Labor Cost vs Extra Costs breakdown per project
Over Budget and At Risk Alerts
Below the charts, the dashboard shows alert tables for projects that need attention:
- Over Budget: Projects where total costs exceed the approved budget
- At Risk: Projects approaching their budget limit
Each row shows the Project Name, Budget, Actual Cost, and the Variance amount.
Cost and Revenue Breakdowns
Two summary panels provide aggregated financial data across all filtered projects:
Cost Breakdown
| Metric | Description |
|---|---|
| Labor Cost | Sum of all timesheet costs across filtered projects |
| Extra Costs | Sum of all extra cost entries across filtered projects |
| Total Cost | Labor Cost + Extra Costs |
Revenue Breakdown
| Metric | Description |
|---|---|
| Fixed Budgets | Sum of budgets from all Fixed Cost projects |
| Client Payments | Sum of payments from all Variable Cost projects |
| Total Revenue | Fixed Budgets + Client Payments |
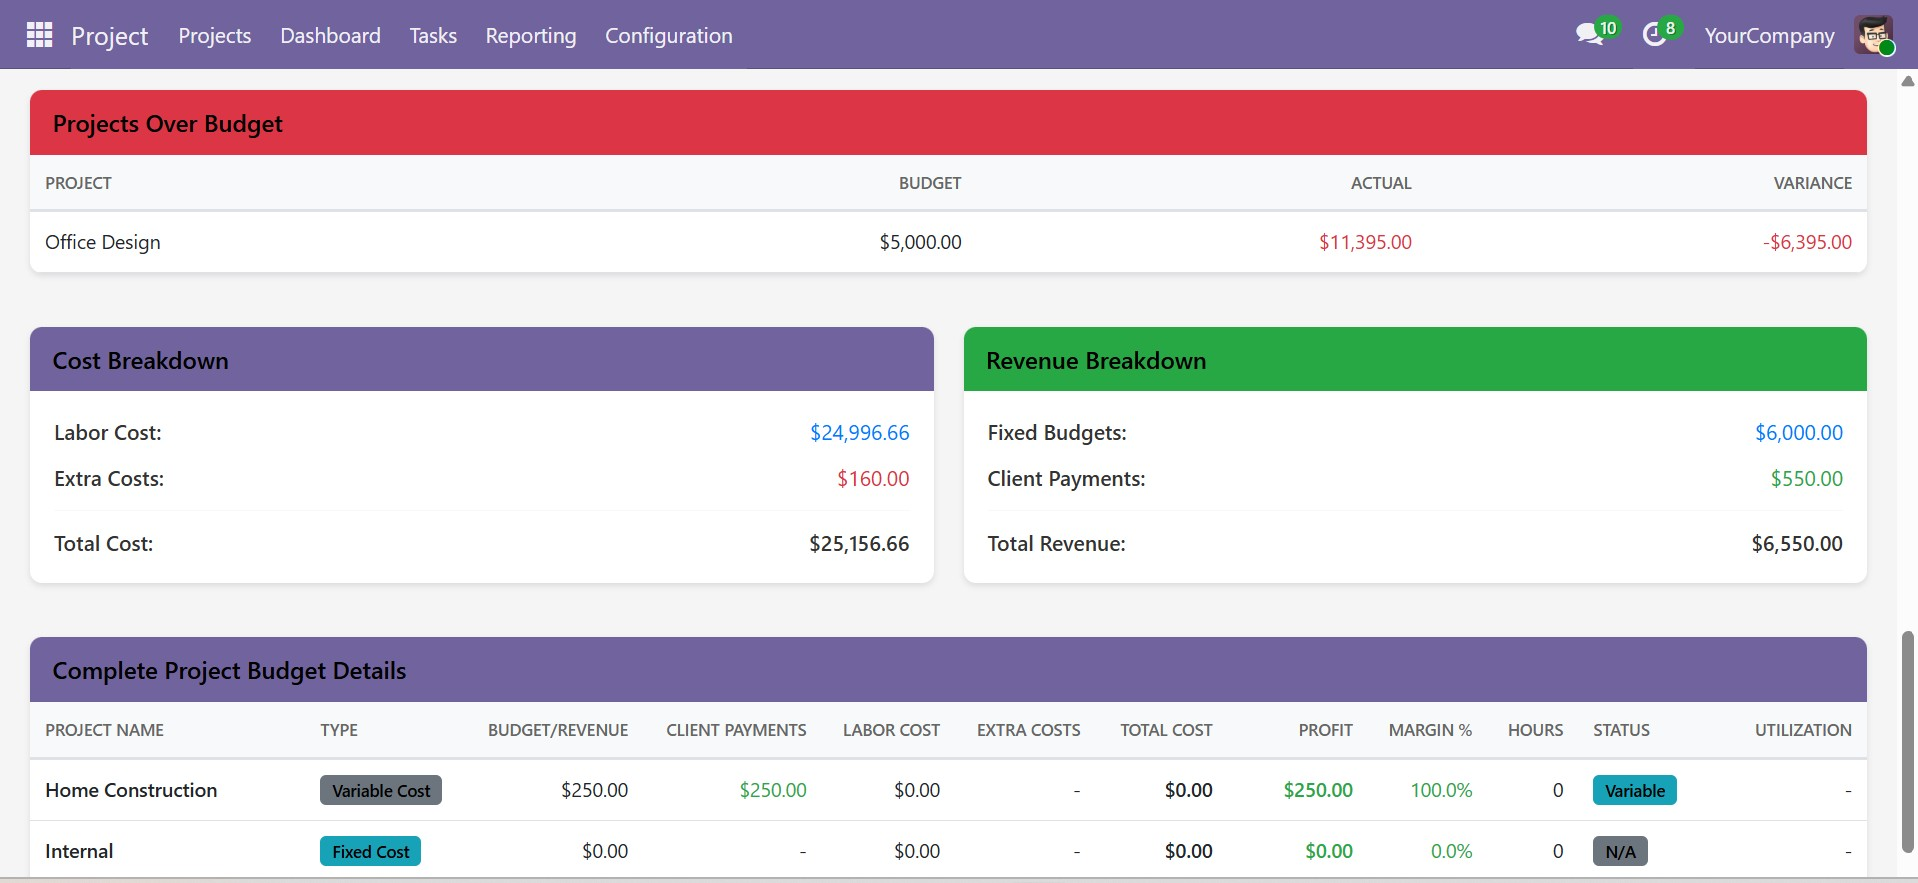 Projects Over Budget alert table with Cost Breakdown and Revenue Breakdown panels
Complete Project Budget Details Table
The bottom section of the dashboard features a comprehensive project-wise financial details table with all key metrics at a glance.
Table Columns
| Column | Description |
|---|---|
| Project Name | Name of the project |
| Type | Fixed Cost or Variable Cost |
| Budget / Payments | Project Budget (Fixed) or Total Client Payments (Variable) |
| Labor Cost | Total timesheet-based employee costs |
| Extra Costs | Total miscellaneous expenses |
| Total Cost | Labor Cost + Extra Costs |
| Profit | Revenue - Total Cost |
| Margin % | Profit / Revenue x 100 |
| Hours | Total hours logged on timesheets |
| Status | Budget status indicator (On Track, At Risk, Over Budget) |
| Utilization | Budget utilization percentage |
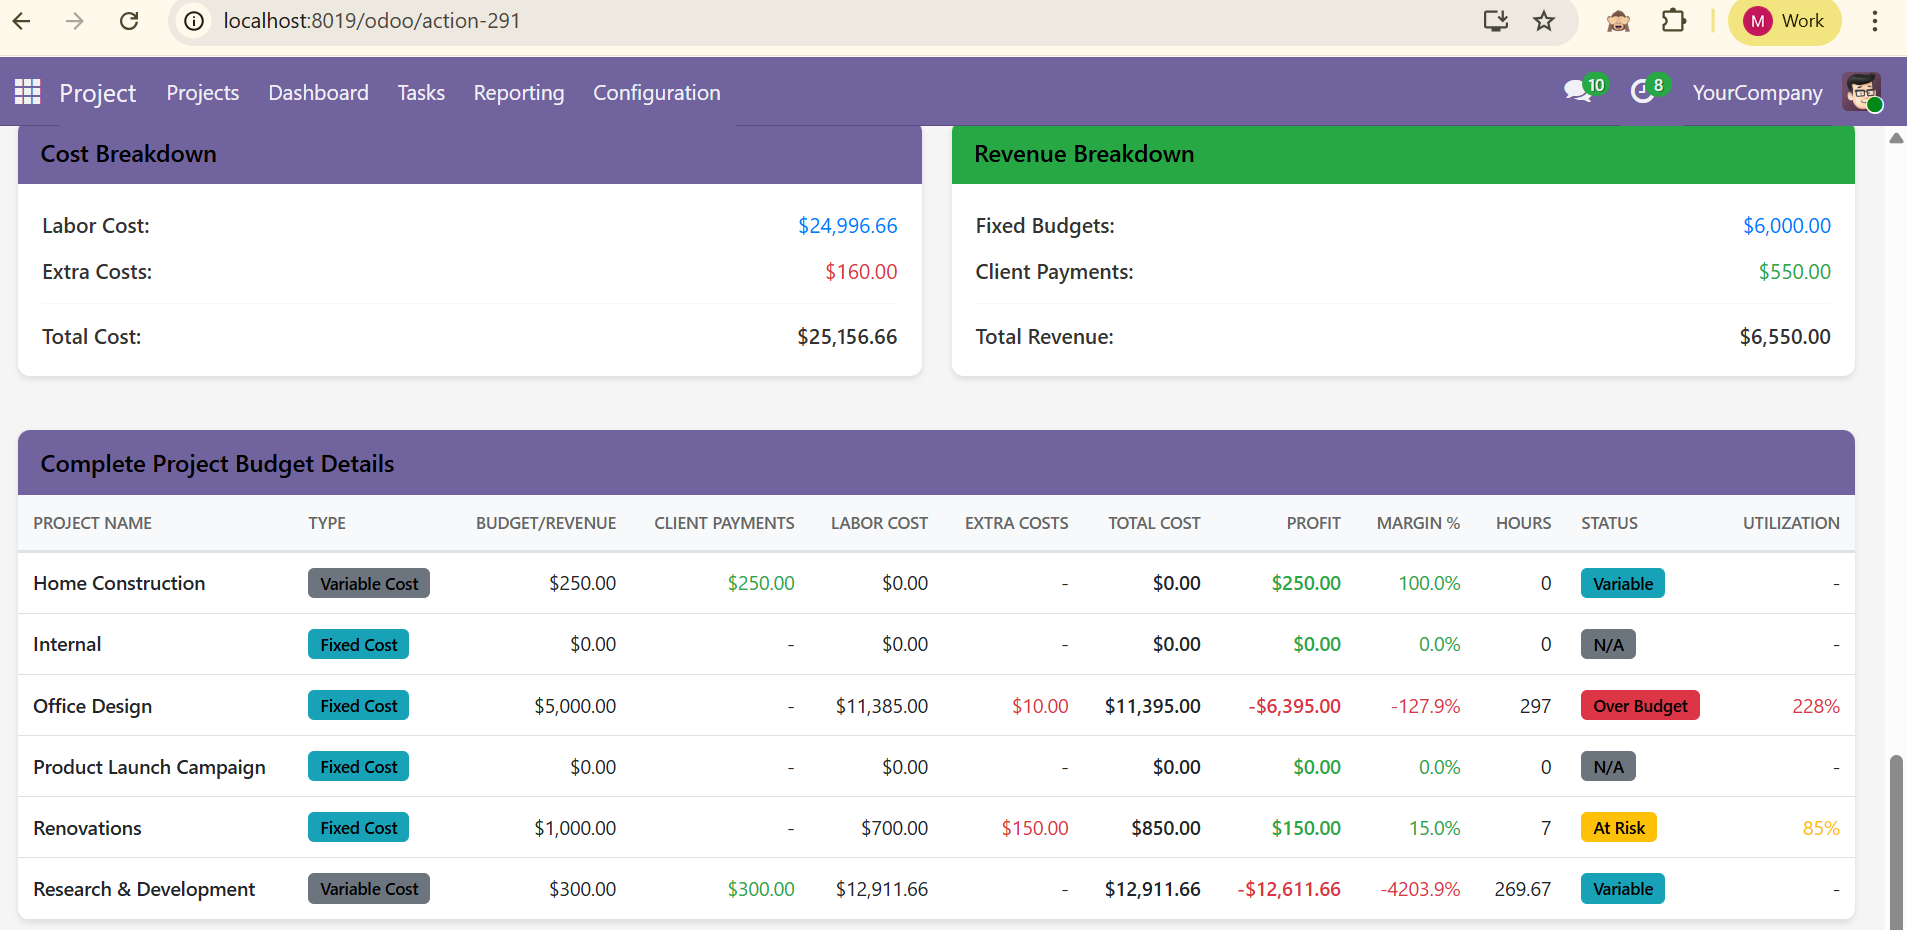 Complete Project Budget Details table showing all financial metrics per project with color-coded status indicators
Status Indicators
Each project row includes a color-coded status indicator:
| Status | Condition | Color |
|---|---|---|
| On Track | Total cost is well within the budget | Green |
| At Risk | Total cost is approaching the budget limit | Orange |
| Over Budget | Total cost exceeds the budget | Red |
Technical Details
The dashboard is built using:
- Owl.js -- Odoo's native reactive component framework for real-time UI updates
- Chart.js -- For rendering bar and stacked bar charts
- Bootstrap -- For responsive grid layout and styling
- Custom CSS -- For KPI cards, color coding, and responsive design
Contact SDLC Corp at sdlccorp.com/contact-us or email sales@sdlccorp.com